

June 12, 2026.
Investor Negativity Bias and Momentum
Negativity about the markets is sabotaging your returns - while simultaneously fuelling the very bull market investors are afraid of.
Imagine any two headlines. One is positive news, the other negative.
Guess which one gets the most clicks? You are correct if you guessed the negative one.

This is not a hunch. This is not a cultural observation.
It is a measurable, peer-reviewed, neurological fact: the human brain is structurally biased toward negative information. And in financial markets, that bias is costing investors real money.
But here is the part nobody talks about.
That same negativity - the scepticism, the distrust, the refusal to believe the market can go up any further - may be one of the key structural forces pushing it higher.
Let me show you why, and how.
The science is settled
Research published in Nature Human Behaviour (Feuerriegel et al., 2023) - one of the largest controlled experiments on news consumption ever conducted, covering over 105,000 headlines and 370 million online impressions - found unambiguously negative words consistently drove more clicks.
Positive news is, effectively, invisible.
A separate study published in Current Psychology (2024) confirmed the same pattern in a different way. Not only do readers select negative headlines at higher rates - they amplify the negativity further when sharing those headlines on social media, adding more negative language of their own. The bias compounds as information travels.
Cambridge's Psychometrics Centre found that this creates a feedback loop: a journalist writes a negative article, readers share it widely, the algorithm surfaces it higher, more people click, and the journalist repeats the negative coverage in the next cycle.
This isn't media malice. It is market forces applied to human attention.
The financial press operates under identical logic. When "Markets tumble amid recession fears" consistently outperforms "Steady growth continues across sectors" in engagement metrics, the editorial decision is not neutral. It is commercial.
The investor's problem
The consequence for the individual investor is severe.
Research tracking the relationship between media sentiment and market performance (Kräussl & Mirgorodskaya, 2017) found that periods of high media pessimism predict lower returns for 14 to 17 months ahead for investors - not because the market falls, but because investors abandon it.
They sell near bottoms. They delay re-entry. They wait for a clearer signal that never arrives.
The Financial Times' own sentiment data has remained persistently negative since the 2008 financial crisis. That's nearly two decades of structurally pessimistic financial coverage - overlapping almost perfectly with one of the most extraordinary bull markets in history.
This is not a coincidence.
It is, in fact, the whole point.
Craig Callahan saw it too
In Unloved Bull Markets (2022), Craig Callahan, documents precisely this phenomenon in forensic detail. His central thesis: the 2009-2020 bull market was, uniquely in modern history, never believed in.
In previous bull markets, investor confidence grew as the market advanced. Not this one.
Unlike any prior sustained rally, investors neither gained confidence nor faith as the market climbed. They remained stubbornly, persistently, sometimes aggressively sceptical. The bull market was unloved all the way to the top.
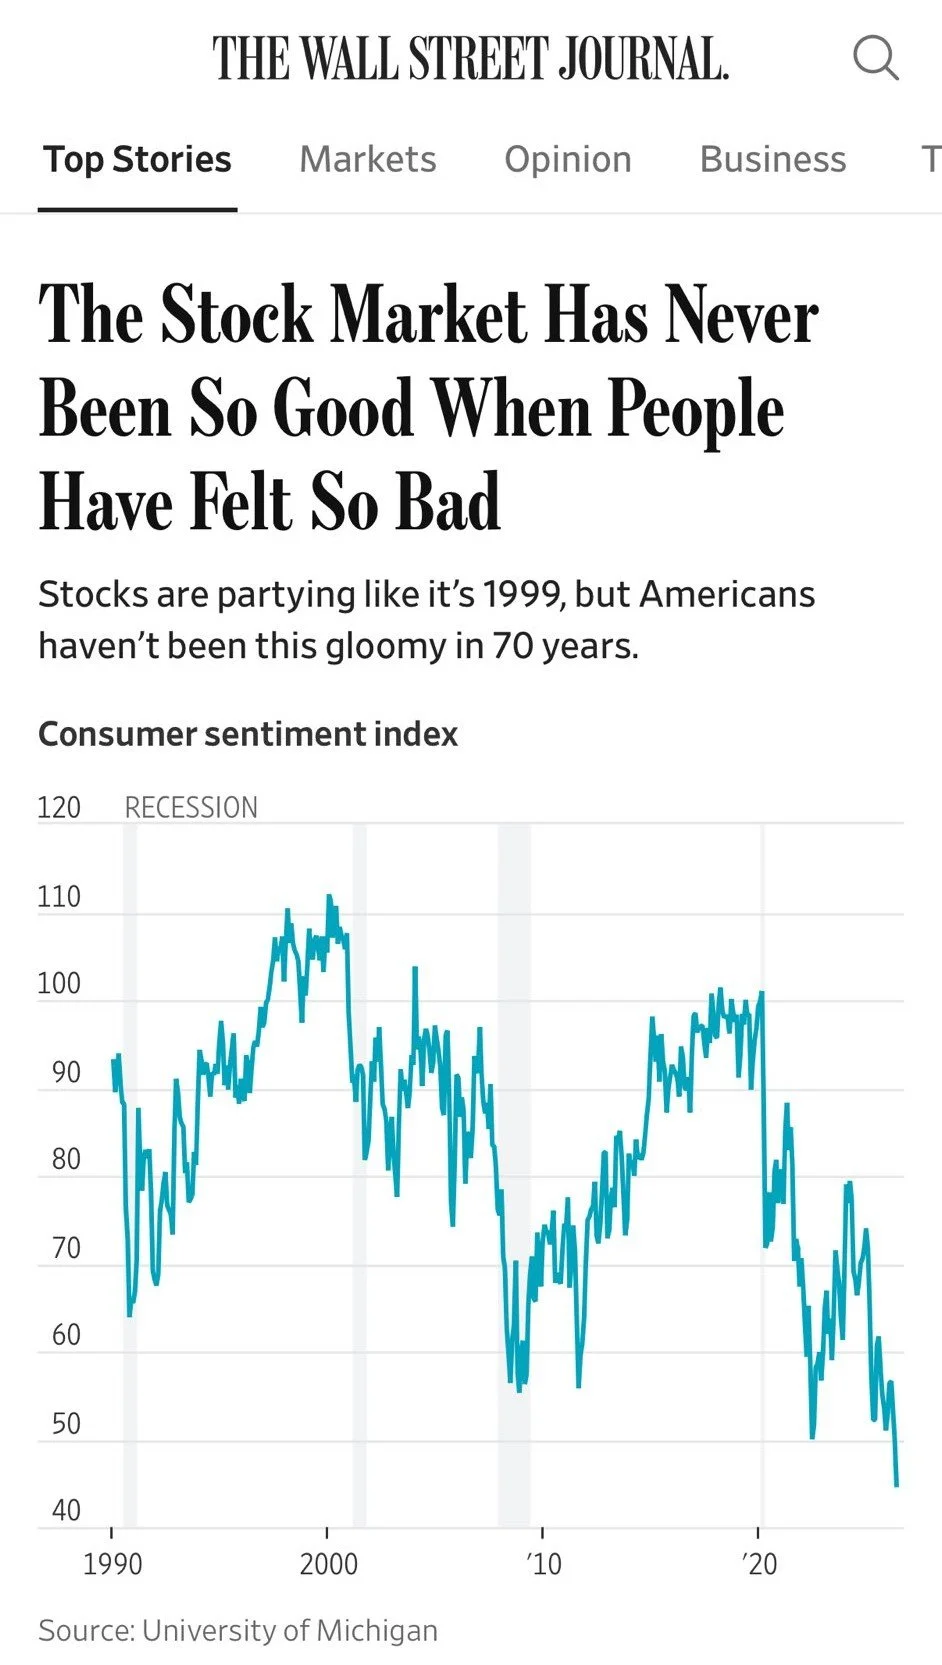
The WSJ chart above says it all. Consumer sentiment near historic lows of 40 on the University of Michigan index. The stock market at all-time highs.
That is not an anomaly. It is a pattern.
Short sellers: the most visible expression of this bias
There is a metric in financial markets that tracks investor scepticism in real time, with actual capital behind it. It is called short interest.
Short sellers are not expressing an opinion on a survey. They are putting money on the line. Their scepticism has a dollar value attached to it.
Here is what the data shows: short interest in major market indices and individual stocks tends to rise as the market goes up.
The bears do not capitulate when proven wrong. They dig in. They rebuild their positions. They add to their short books as prices climb further and further away from their thesis.
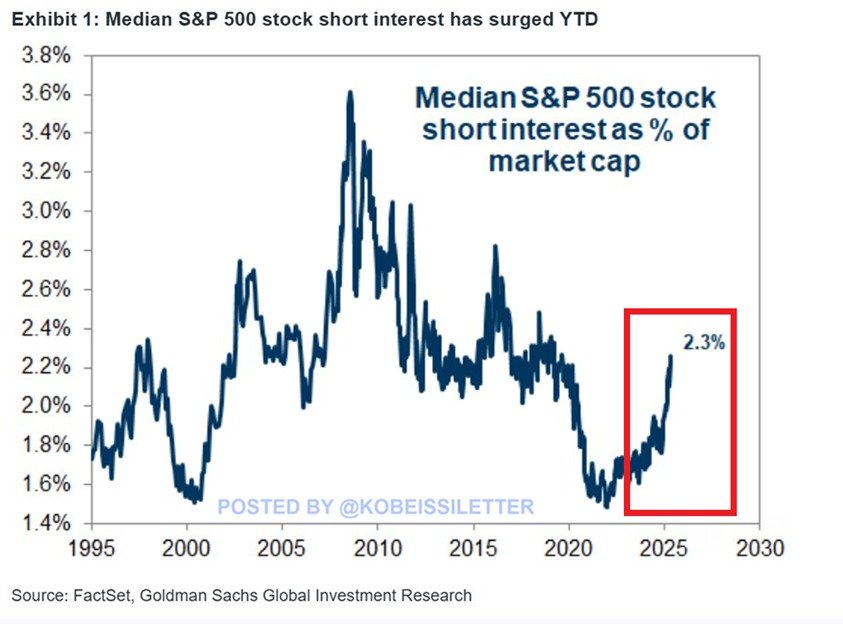
This has been documented repeatedly. Data consistently shows the median S&P 500 stock is now seeing short interest at a ten-year high - even as the market sits near all-time peaks.
The bears keep stepping in front of the steamroller. The steamroller keeps winning.
Here’s my theory. And it is, I confess, a theory.
I want to propose a momentum mechanism. It is not in the academic literature, at least not in this form. But I believe it is real, and I believe the evidence supports it.
The academic community knows that momentum exists. What is less clear are the reasons for momentum. We know it is a possible range of reasons, and not any one in isolation. Here comes another possible contributing reason.
Investor negativity bias might be creating momentum.
Here is how the loop works.
The market rises. Making new highs.
Investors, hardwired by evolution to distrust good news, remain sceptical. They stay out, or sell too early, certain that a correction is imminent.
Because they are out, or lightly invested, the market is not being sold aggressively. Supply pressure is low. The buyers - pension funds, passive index vehicles, systematic strategies - continue their mechanical, undramatic accumulation.
The market continues climbing. Short sellers, emboldened by what looks like an irrational or overextended rally, increase their bets against it.
Eventually, something forces their hand. A piece of good news, an earnings beat, a macro surprise. The shorts are squeezed. They must buy to cover. Simultaneously, the side-lined investors - watching the market move further away from where they planned to enter - experience FOMO and rush in.
This surge of forced buying and re-entry buying creates the very spike in price that momentum strategies detect and exploit.
The market prints new highs. Returns to Step 1.
Negativity, in other words, does not merely keep investors out of the market. It loads the spring.
The longer and more intensely the bears resist, the more violent and sustained the eventual move upward tends to be.
The unloved bull market is not weak because it is unloved. It is strong precisely because it is unloved.
The momentum connection
Momentum strategies, including our own at AlphaScience, detect persistent price strength across several months.
They identify stocks where the trend has been sustained and consistent. They do not ask why the stock is going up.
They ask whether it has been going up, for long enough, and with enough conviction, to suggest it will continue.

This is also, incidentally, why momentum strategies often perform best in the later stages of a bull market: the negativity has been building for longer, the shorts are more crowded, and the eventual release of that energy is correspondingly more powerful.
What this means in practice
The practical implications are not subtle.
If you are an investor who has been waiting for the "right moment" to enter - for a correction, for a cleaner chart, for better news flow - the evidence suggests you have been waiting for the wrong thing. The negative news is the signal. Not to stay out, but to pay attention.
If you are someone who reads financial media every morning and allows that consumption to shape your portfolio decisions, the research is clear: the more financial news you consume, the worse your investment outcomes are likely to be. The headlines are not neutral information. They are commercially optimised fear delivery systems.
And if you believe, as I do, that the same negativity bias that keeps investors sidelined also powers the eventual price surge when they return - then you understand why staying invested through periods of maximum pessimism is not courage alone:
It is a strategy.
Blog by Etienne Botes
References:
Callahan, C. (2022) Unloved Bull Markets: Getting Rich the Easy Way by Riding Bull Markets. Wiley.
Feuerriegel, S., Robertson, C.E., Pröllochs, N., Pham, H., Teague, S., Gibbs, S., et al. (2023). Negativity drives online news consumption. Nature Human Behaviour, 7, 812–822.
Kräussl, R. and Mirgorodskaya, E. (2017). Media, sentiment and market performance in the long run. European Financial Management, 23(1), pp. 49–71.
Watson, J., Stillwell, D. et al. (2024). Negative online news articles are shared more to social media. Scientific Reports. Available at: https://www.nature.com/articles/s41598-024-71263-z (Accessed: 10 June 2026).
Zhang, Y. et al. (2024). Negative news headlines are more attractive: negativity bias in online news reading and sharing. Current Psychology. Available at: https://link.springer.com/article/10.1007/s12144-024-06646-6 (Accessed: 10 June 2026).
April 27, 2026.
Creativity: The Unspoken Edge in Fund Management
I have been to numerous fund management conferences. I have read countless articles about investment strategies, fund operations, and regulation (zzzzz).
But the one word I have never seen associated with our industry is creativity. Why is that?
Part of the answer lies in history. The word "creativity" in finance has long carried uncomfortable connotations - as in "creative accounting."
That baggage is a genuine shame, because creativity is something our industry should celebrate openly, as both a differentiator and a driver of real performance. At best, it is only now beginning to be applied to marketing materials and websites.
But creativity is so much more than that.

A culture of creativity?
Is there a culture of creativity in the financial industry?
The data, frankly, is damning. A survey of staff from over 100 investment firms found that only around 7% believe their firm has a culture of creativity - yet 25% identify creativity as essential to success. That gap between what professionals have and what they actually want tells you everything about a quiet crisis hiding beneath all those navy-blue suits.
Many years ago, before I entered fund management, I worked in the advertising industry - in strategic planning. How's that for a career change?
And yet I have found creativity to be an essential ingredient in both worlds.
At AlphaScience, we manage a quantitative momentum equity strategy. Everything we do has been through the harsh mill of the scientific method. We have deliberately removed the idiosyncrasies of human emotion from portfolio management.
And yet creativity has always been the driving force behind our innovations, improvements and new ideas. It is not merely something we celebrate - we deem it absolutely essential to our process.
But here is the thing: I do not believe we are unique in this.
Creativity in investing is, at its core, about doing what no one else is doing - and yet the vast majority of funds remain rigid in their approach, with a "set in our ways" mentality that permeates virtually every level.
Despite this, I believe a huge amount of what the fund management industry actually does is driven by creativity. Regardless of style, strategy or product, creativity is the reason for its existence.
It’s about ideas
There is a compelling academic framework that makes this connection explicit.
The psychologist Robert Sternberg proposed what he called the "Investment Theory of Creativity" - the idea that creativity is, at its heart, a decision to do something different in the world of ideas.
Creative individuals generate ideas that initially seem novel, perhaps even slightly ridiculous, and are therefore undervalued by the crowd. Sternberg also argues that the greatest obstacle to creativity is rarely external pressure; it is the limitations we place on our own thinking.
The willingness to redefine problems in novel ways, to take sensible risks, to persevere in the face of scepticism, and to constantly examine whether one's own preconceptions are getting in the way - these, he says, are the hallmarks of the creative mind.

Doing something different
Our entire system was built on going against the grain.
Momentum investing was, for a long time, deeply unfashionable - viewed with suspicion by a profession wedded to fundamental analysis and the “efficient market hypothesis”.
We believed in it anyway, built a rigorous scientific framework around it, and kept refining it.
The Vortex Indicator - one of our key innovations - was not conceived in a boardroom. It came to me while fly-fishing in a river. Sternberg would not be surprised. His research is clear that creativity flourishes not through force, but through environment: the right attitude, the right freedom, and the willingness to think for yourself.
That, more than anything, is what we try to protect at AlphaScience.
An uneasy fit
The problem is that great ideas cannot be scheduled. They need free time. Time away from the screen and the office.
My best ideas have come from hiking on the farm, walking in the garden, or simply lying in the bath.
A little isolation, away from the noise of everyday life.
Peter Lynch - who managed Fidelity's Magellan Fund to legendary returns - described something similar: profitable insights arriving when he was out shopping or at home with his family. The pattern is consistent. The best ideas arrive sideways, when the mind is allowed to wander.
And perhaps that is exactly why our industry struggles with "implementing" creativity: because it cannot be immediately quantified.
Paying a portfolio manager to simply think - uninterrupted - feels uncomfortable. And yet the next idea they surface could supercharge returns for years to come.
Creativity, in that sense, directly creates wealth.

Signs of hope
In the world of finance, creativity is making a comeback as firms such as BlackRock are hiring liberal arts grads for their fresh ideas and critical thinking skills. And with Al taking over routine tasks, creative thinking is becoming more valuable by the hour. This is a direct quote from them. Isn’t that ironic?
The more AI is taking over our lives, the more the world is realising it is human beings who possess that magical thing that AI cannot replicate.
That is why I believe fund management is an ideas business and therefore a creative industry - far more than it gives itself credit for.
It is just a shame we seem almost embarrassed to admit it.
A blog by Etienne-Paul Botes
References:
Ware, J. and Voss, J. (2019) 'Creativity in Investment Firms: Five Conditions to Improve It', CFA Institute Enterprising Investor, 12 December. Available at: https://blogs.cfainstitute.org/investor/2019/12/12/creativity-in-investment-firms-five-conditions-to-improve-it/ (Accessed: 25 April 2026).
Sternberg, R.J. and Lubart, T.I. (1991) 'An investment theory of creativity and its development', Human Development, 34(1), pp. 1–31.
Currie, L. (2024) 'The fascinating reason why the UK's biggest financial institutions are getting creative', Tempus Magazine, 21 October. Available at: https://tempusmagazine.co.uk/news/the-fascinating-reason-why-the-uk-biggest-financial-institutions-are-getting-creative/ (Accessed: 27 April 2026).
April 18, 2026.
America and the Exceptionalism Premium

Let America be America again.
Let it be the dream it used to be.
Let it be the pioneer on the plain
Seeking a home where he himself is free.
…
Let America be the dream the dreamers dreamed -
Let it be that great strong land of love
Where never kings connive nor tyrants scheme
That any man be crushed by one above.
The poem quoted above was written by Langston Hughes, not in 2026 but in…1935.
I must admit, it is very difficult these days to have any conversation about the United States without evoking some deeply negative reactions. That is entirely understandable.
But then, on 1 April 2026, we watched the glorious sight of NASA's Artemis II launch.
I am man enough to admit I had tears in my eyes.

It was not merely the fact that we are reaching for the stars again.
That we all can dream big, expand our knowledge, and explore once more.
No, it was something else entirely. Watching that rocket climb into the sky, I thought to myself:
this is America.
The true United States. The nation of pioneers. Of science and intellect and collaboration.
Of celebrating what human beings are capable of at their absolute best.
Politically speaking, that guy will soon be gone. Things will return to normal. As the saying goes, "this too shall pass."
But here is what I keep reminding people. The president is not the United States. The US economy remains the most powerful in the world - and the private sector, the capitalist foundation, and the structural forces behind the stock market are far stronger than any single president.
History also reminds us that the stock market and the economy are not the same thing. The market has outperformed during difficult economic periods and underperformed during apparently strong ones.
The sheer scale of the place
So let us start with size. Because the numbers, once you actually look at them, are staggering.

Yes. That is the entire United Kingdom fitting inside Florida, and half of Atlanta.
Next is an infographic of sizes of economies around the world by GDP. The last column is 2025.
The fact that the US is at the top is not much of a surprise, but it is the detail below that made me
fall off my chair.
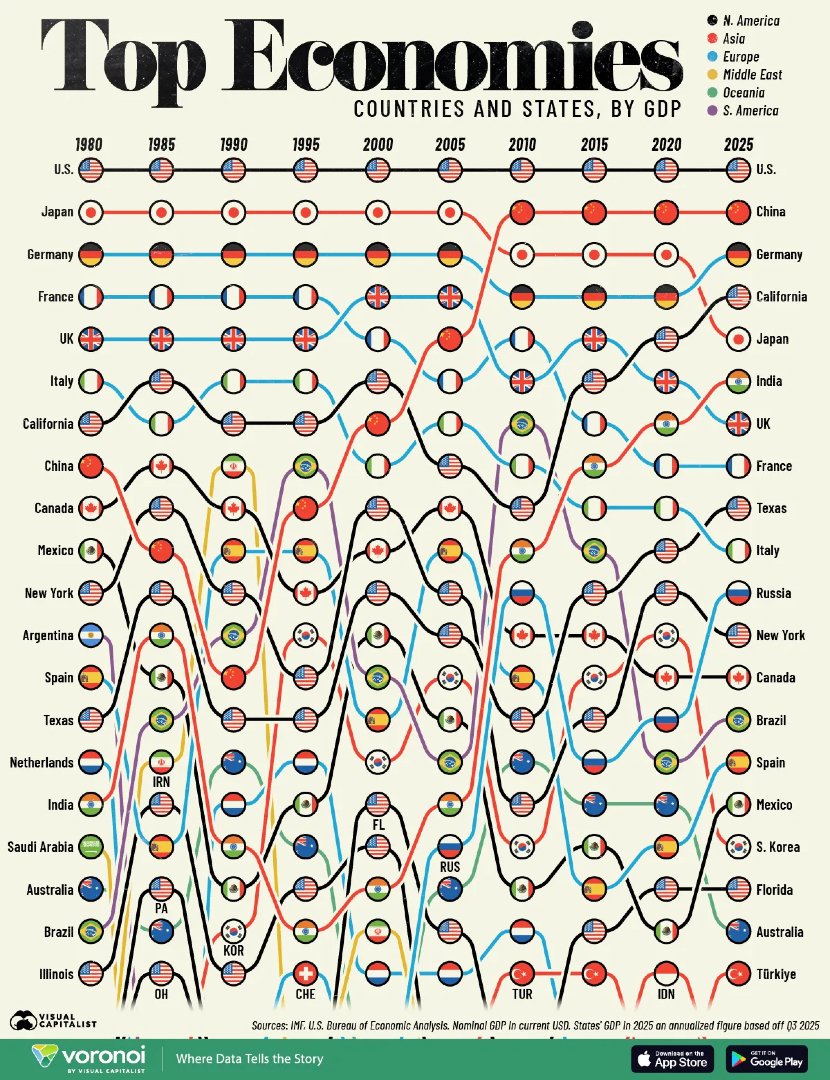
Image Credit: https://www.visualcapitalist.com/
There are individual states in the US that is bigger than entire countries.
California is bigger than…Japan?
California is the 4th largest economy IN THE WORLD.
Let that settle for a moment: a single American state is duelling with Japan for a position in the global top five.
Texas is larger than Italy or Russia. New York state, on its own, has a GDP broadly equal to the whole of Canada.
Read that again.
The size of the US stock market
Now let us talk about the size of the US stock market specifically. There is considerable noise at the moment about China, but let’s look at the context:
The total market capitalisation of US stock markets stands at approximately $69 trillion.
The combined capitalisation of the Shanghai, Shenzhen and Hong Kong exchanges is approximately $22 trillion.
The US equity market is therefore roughly three times the size of China's combined exchanges.
European stock markets collectively come in at approximately $23 trillion, broadly comparable to China.
But size alone is not the whole story. It is the consistency with which the US outperforms every other major market over the long term that is truly striking, particularly relative to China and Germany (as an example of an European country).
So why does the US deserve an “exceptionalism premium”?
Consider this: American companies dominate the world's most profitable corporations.
Roughly half of the world's 50 most profitable companies are headquartered in the United States, and in the technology sector specifically, that dominance is near total.
Alphabet, Apple and Microsoft each generate over $100 billion in annual profit. That is not an accident of geography.
It is the result of a set of conditions that, taken together, are extraordinarily difficult to replicate elsewhere.
The virtuous cycle of investment and innovation
The standard explanation for American corporate dominance is cultural: Americans are entrepreneurial, they embrace risk, they are comfortable with failure and try again.
There is truth in that. But the more interesting answer lies in what I would call the compounding engine of investment and innovation. It works like this:
Markets with innovative, profitable and growing companies attract investors.
More capital becomes available to companies, lowering their cost of financing.
This attracts more entrepreneurs, more talented people, and more ambitious companies.
Greater competition and ambition produce more innovation, stronger productivity, and better earnings growth.
Better earnings attract yet more capital - and so the cycle repeats, building on itself.
This is not simply a virtuous circle. It behaves like a network effect, where the value of the system grows disproportionately as more participants join. America's scale has amplified this effect to a degree that no other economy has matched.
The right environment
But for this engine to function, the environment has to be right. A plant does not grow in poor soil, regardless of the quality of the seed. Businesses are no different. The conditions that make this cycle possible include:
Respect for property rights and the rule of law
Rigorous accounting standards and listing requirements
Strong corporate governance that protects shareholders
A relatively low bureaucratic burden
Low levels of corruption (except at the top, currently)
A genuinely independent central bank, free to pursue sound monetary policy
An independent judiciary, free of political interference
Openness to foreign investment
Competitive taxation
Most countries fall short on several of these simultaneously. The United States, for all its current political noise, has historically delivered on most of them, most of the time. That institutional depth has been built over centuries, and it does not evaporate with a single election cycle or even a difficult presidency.

That is the foundation. It is why capital keeps returning. It is why the most ambitious founders and engineers still want to build there. And it is why, as long as that institutional bedrock remains intact and new innovative companies continue to emerge, the US market is likely to keep compounding ahead of its peers over the long run.
The current moment feels turbulent. It is. But turbulence and trajectory are not the same thing.
As portfolio managers, we are paid to think beyond the noise and focus on where the structural weight of evidence points.
Right now, as it has for decades, it points to America.
Blog by Etienne Botes
April 5, 2025.
Momentum in Bear Markets
It is 2026.
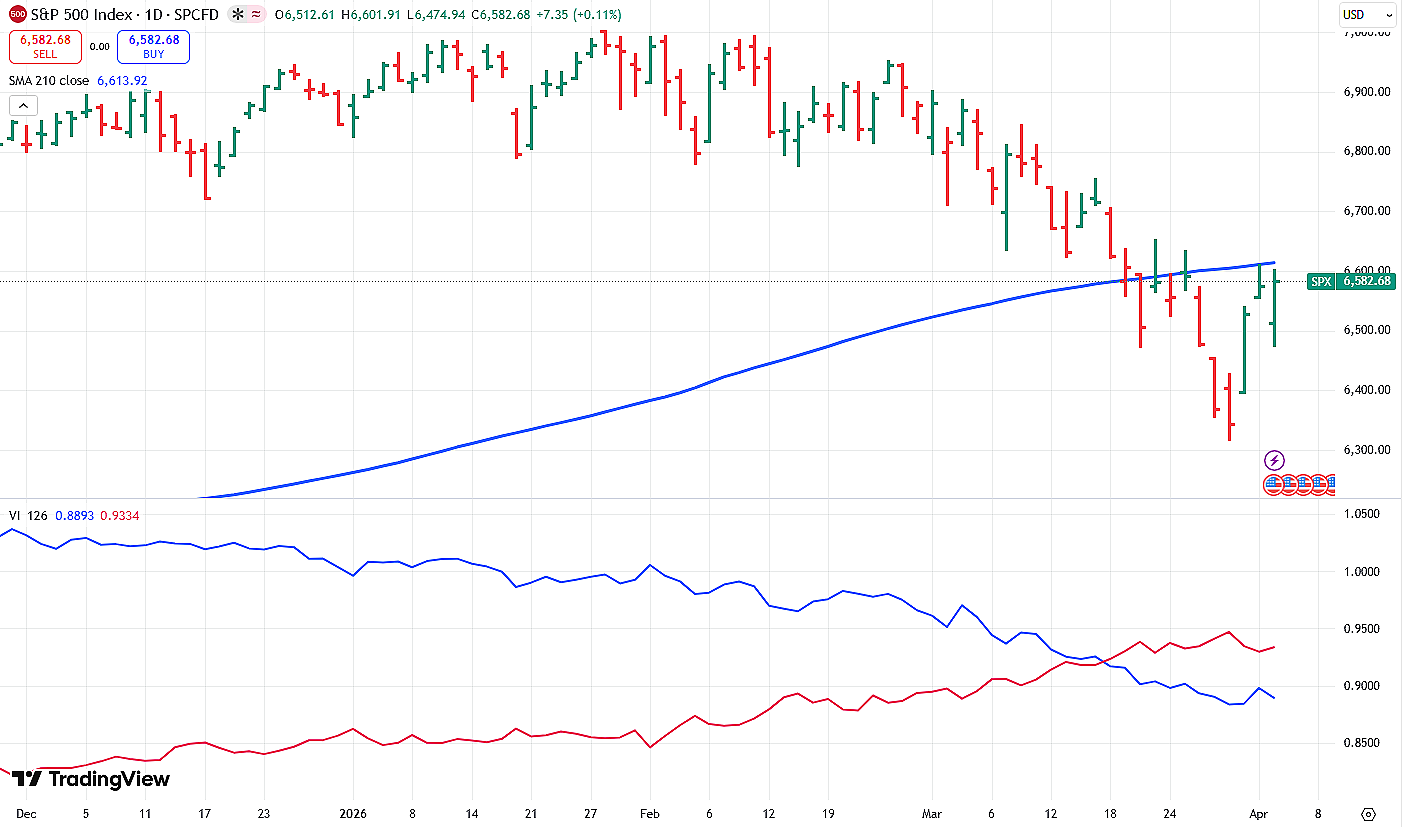
On the 18th of March, my long-term 6-month Vortex Indicator crossed over, signalling a change in the overall market trend.
On the 20th of March, the S&P 500 collided with its own long-term 200-day moving average, used by the entire industry as a barometer of the trend of the market.
But are we in a bear market?
Maybe, maybe not.
This signals that the music has not yet stopped, but has certainly slowed down, to paraphrase Peter Sullivan from the movie "Margin Call".
The truth is, we usually only identify these turning points accurately in hindsight. I'm not joking: bear markets are notoriously difficult to identify at the onset.
So the main question in this blog is: what is a bear market, what happens to momentum strategies when one arrives, and what should a portfolio manager and investor actually do?
Why do bear markets happen?
More sellers than buyers in a short time. Simple, right?
Bear markets usually have a single overarching cause, with cascading effects through domestic and international economies. Stock markets react first.
The reason this time is clear: a miscalculated and ill-planned military attack on Iran, which has escalated into a geopolitical conflict that has dramatically impacted the price of oil. The world will soon discover that it is not just the price, but the supply of oil that will wreak havoc, even if the conflict stops tomorrow.
Mark Twain famously said: "God created war so that Americans would learn geography."
Somehow, the strategic importance of the Strait of Hormuz was completely overlooked by the US. Except perhaps for the hundreds of highly educated military strategists, energy analysts, intelligence experts, and specialists in Middle Eastern affairs in the US who were simply ignored and side-lined.
So here we are…

This is what happens when you don’t understand geo-politics.
What is a Bear Market?
There is no strict scientific definition, only what the financial industry has agreed upon through convention. So let's define the terminology clearly.
What is a correction?
A decline of more than 10% but less than 20%. The 10% threshold is arbitrary, but significant. Corrections are common (there have been 10 since the year 2000) and usually short-lived, lasting an average of three to four months.
At the time of writing, on the 1st of April 2026, the S&P 500 has made a low of -9.79% from its peak. Technically, despite the bad news and negativity, we are not even in correction territory.
Yet.
However, the Nasdaq has already made a low of -12.76%.
Corrections hurt short-term investors. For those with longer time horizons, they present really good buying opportunities.
What is a crash?
A crash is when markets plummet more than 10% in a single day. The Great Crash of 1929 saw drops of 13% and 12% on successive days. Black Monday in October 1987 saw a single-day fall of 23%. And on the 16th of March 2020, the market dropped 13%.

And a bear market?
Bear markets are declines of at least 20%. They tend to last longer than corrections. The standard industry method is to declare a bear market when major indices fall below their 200-day moving average.
Personally, I find this a dumb indicator. Due to how a moving average is calculated, if the market trades sideways for long enough, the average will simply "collide" into price, even when the market isn't actually falling.
Wall Street considers a bear market over only when the stock market closes at a new record high.
Do all corrections lead to bear markets?
No. Going back to 1975, only 6 of the 27 market corrections have turned into bear markets. And there is no reliable way to predict in real time whether a correction is the beginning of something worse.
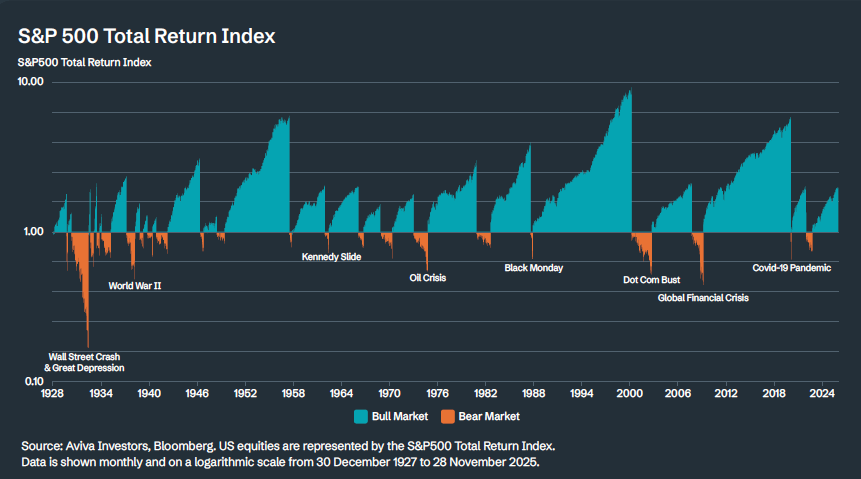
The silver lining: bear markets are shorter than bull markets. Historical data from the S&P 500 between 1926 and 2025 shows:
The average bear market lasted 1.5 years, with an average loss of -35%
The average bull market lasted 4.9 years, with an average return of 178%
Speed and gradient
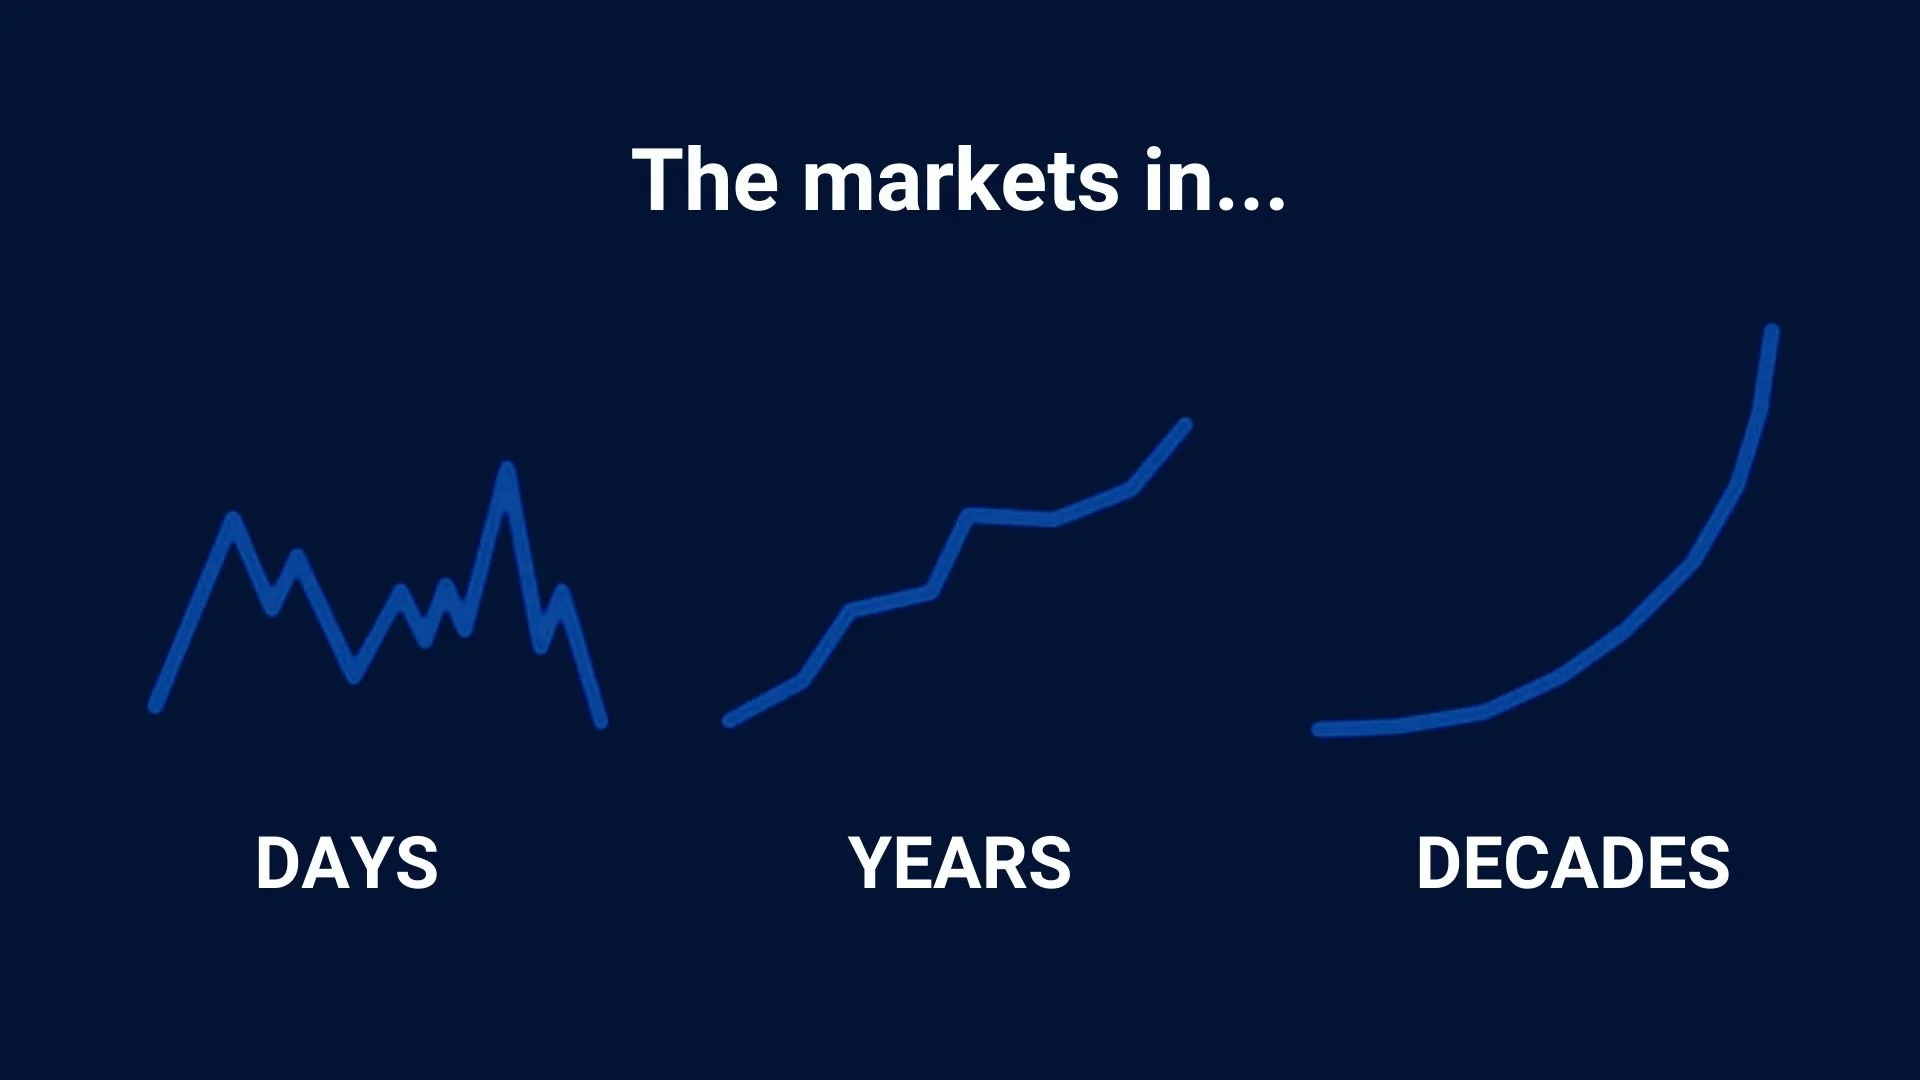
What makes bear markets so devastating is not just the magnitude. It's the speed, and the steep gradient staring at you from a chart.
Bull markets are frustrating in their own way too. Slow. Shallow-angle climbs. Two steps forward, one step back. You never really feel like you're in a bull market, except when you look back over the past few months or years. It takes a year or two to build up a decent return, and then a bear can strip most of it back in a few brutal months.

Human perception and markets
I have another hypothesis. It's about the visual way markets are represented on a chart.
A bull market looks like a mountain we perceive as difficult to climb. It appears to fight gravity. When the market turns, gravity finally seems to win. The downward slope feels almost natural.
Add to this our pathological attraction to bad news. Negative economic articles consistently outperform positive ones in readership. Craig Callahan devoted an entire book, Unloved Bull Markets, to documenting how endemically sceptical investors are about bull markets, to their own considerable cost.
What does a bear market look like in monthly returns?
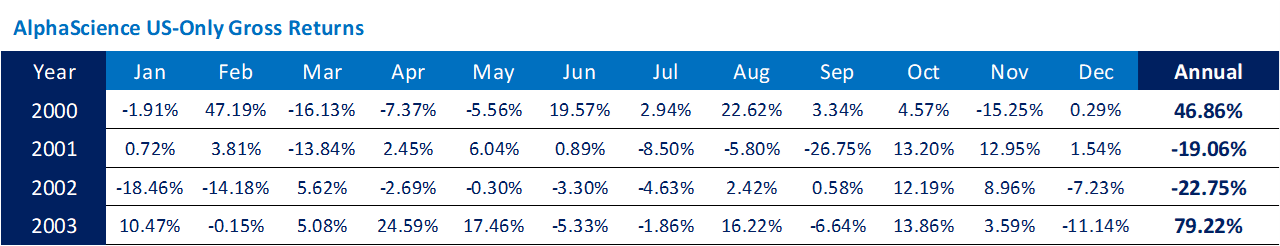
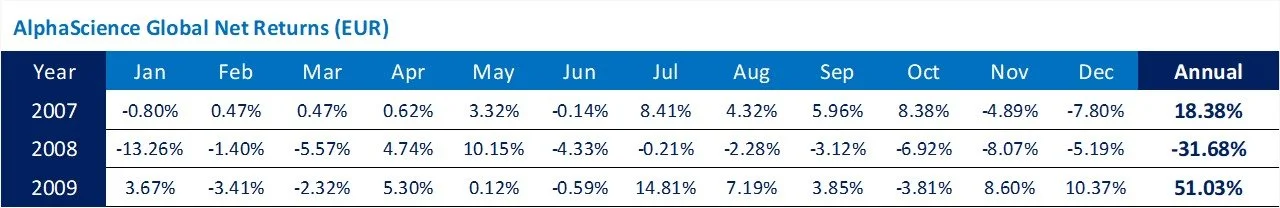
It is no use simply telling you by how much the market fell between 2000 and 2002, or that the financial crisis of 2008 was devastating. Those numbers are easy to read unemotionally from a distance.
You need to see what it means month to month to month. Read them slowly:
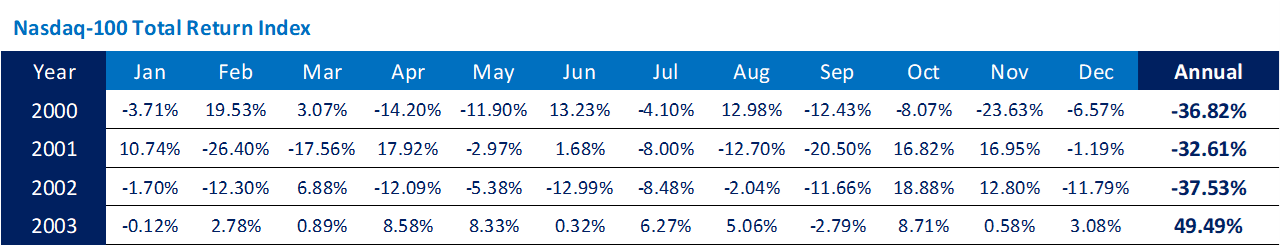
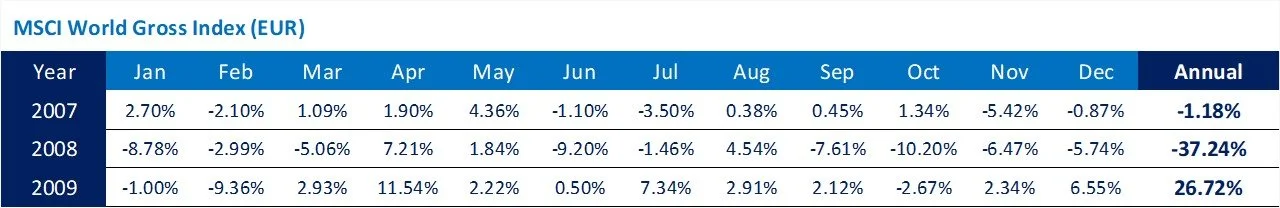
Simply looking at these numbers is painful enough. Living through them is something else entirely. It feels like the end of the world, with no end in sight.
Here is my guarantee: if you are involved in financial markets as either investor or portfolio manager, you shall encounter corrections and bear markets during your career, sprinkled with the occasional crash just to build character. They have happened before. They will happen again.
But we're still here. They are not terminal.
Bear markets always end. The sun shines again. It happens when the overarching problem gets solved, or worked through, or in some cases the market simply gets used to it and starts buying again.
And here is the even better news.
Recoveries after prolonged bear markets can be explosive and sudden. If you think a bear is dangerous, an aggressive bull is even worse for those caught on the wrong side. Large institutions buying bargains at scale, followed by an army of FOMO investors piling in, produce some of the most violent and rapid rallies in market history.
How do momentum strategies perform in bear markets?
Here's the thing about a full-blown, long-term bear market.
The entire stock market is affected. All stocks sink. Doesn't matter what they are. Some fall faster than others, but there is no place to hide. Suddenly, correlation between all stocks goes to 1.
The good news: some stocks fall less than others. Some stocks are less weak than the market or their peers. If a momentum strategy like ours at AlphaScience rebalances every month, the system will eventually find and select those stocks. But they only really emerge if the bear market is a prolonged affair. In the short term, there is always pain.
Here is where momentum truly shines, though. And this is key:
A momentum strategy will typically have outperformed the market significantly before the bear market even begins, creating a performance buffer, a "risk budget", before the dark days arrive.
And momentum strategies tend to recover faster from bear markets than the market itself:
AlphaScience 5-stock Momentum portfolio.
AlphaScience 10-stock Global Momentum portfolio
Can a momentum strategy protect itself from bear markets?
For years we have studied bear markets. It has been, and probably will remain, a puzzle we would always like to solve. But do we need to?
The core challenge is accurately identifying a change in market trend at the very onset. Even with the most robust trend indicator available, the timing is never 100% accurate. The best indicators lag by design, to avoid false signals, and that lag becomes painful when a bear market ends suddenly in a sharp V-shaped recovery.
Strategies we tested
Potential strategies fall into two broad categories: permanent hedges and regime-switching approaches.
Permanent long-short: A portion of the portfolio is permanently short the weakest momentum stocks, in ratios of 50/50 or 75/25.
Switching: A good acquaintance of mine, Andreas Clenow in Zurich, has written an excellent book on momentum investing. His approach uses the 200-day moving average to classify the market regime as a bull or a bear. (We have found our Vortex Indicator to be more accurate and reliable.) The idea is to switch from long-only to either completely short or long-short, long-cash, long-bonds, or even to exit the stocks entirely, as suggested by Andreas.
Futures and options: Protective instruments triggered by the market regime filter.
Delayed entries: A more creative idea. In a bear market, no stocks are bought immediately. Buy orders are placed at a predetermined level above the current price, triggering only if the market rises. If never triggered, the position is never taken.
Stop-loss strategies: Fixed percentage stops, volatility-based stops, trailing stops. All extensively tested.
And many, many others.

You may be impressed by all the creative solutions we have explored.
You know what?
They have all been rejected.
The reason is simple. All of them represent a massive compromise in performance without a significant saving in risk during crisis periods. The permanent long-short strategies absolutely do reduce bear market losses, but they drastically dampen performance in the good months, making them pointless underperformers over the long term. (Let's not even talk about all the other headaches involving shorting stocks.)
The other market regime-switching strategies depend entirely on the accuracy of the trend classification tool. Even with the most accurate indicator we know of, it is still prone to being too late, too early, or simply wrong. The human race cannot and will not solve this problem accurately. So let's stop trying.
Our findings
Simply adopting a long-only strategy is by far the best approach, and that conclusion is the result of years and years of research.
Stay invested. Stay disciplined. Stay systematic.
This is not foolish courage. This is not irresponsibility. This is based on long-term evidence and the mechanics of a system that selects the best momentum stocks every single month, even in a falling market. This is how you beat a bear over the long term.

But do we actually need to "solve" a bear market at all?
In a previous post, I have made the point that it is critical for a momentum portfolio manager to simply be honest and transparent with a client.
It is not our task to protect against a bear market. We are not a one-stop investment shop. We are not a silver bullet total market solution. We are not your hedge. We are not offering uncorrelated returns. We offer outperformance of the market over the long term. We fit into a specific place in the investor's overall portfolio.
But here's the best part.
I have written at length elsewhere about the folly of "timing the market." But a bear market is actually one of the few cases where timing has a logical basis. Entering at any point during a bear market means entering at a discount. The market will eventually recover. It always has. Those who enter during the drawdown capture the full force of the recovery.
That is the only genuinely clever timing strategy.
Other than that, the only real requirement for investors and portfolio managers is simple.
Courage.
References:
Clenow, A.F. (2015) Stocks on the Move: Beating the Market with Hedge Fund Momentum Strategies. CreateSpace Independent Publishing Platform.
Callahan, C. (2022) Unloved Bull Markets: Getting Rich the Easy Way by Riding Bull Markets. Wiley.
Blog by Etienne Botes
January 23, 2026.
Snipers – not infantry
Let me start with something important: I hate war. I dislike conflict and violence. I consider myself a pacifist.

That said, I have always been fascinated by military strategy. Not because of destruction, but because of how carefully resources are allocated, risks are managed, and objectives are achieved under uncertainty.
Surprisingly, investment portfolios work in much the same way.
Not every unit has the same job. In any serious military operation, some units hold the line, some provide stability, and highly specialised teams are deployed with precision to achieve very specific mission objectives.
No commander expects a sniper to replace the infantry. And no sophisticated investor expects a single investment to do everything.
So where does momentum investing fit into a typical investment portfolio?
More to the point: where does AlphaScience fit?
The Classic Investment Portfolio
Most people are familiar with the traditional 60/40 portfolio:
60% stocks for growth
40% bonds for stability and income

This structure made sense for decades, especially for retail investors. It is simple, easy to explain, and reasonably safe.
The stock portion aims for long-term growth, accepting market risk and volatility. The bond portion provides regular income and helps protect the portfolio during downturns.
Over the last 20 years, ETFs (Exchange Traded Funds) have transformed investing. A single, low-cost ETF can provide instant exposure to thousands of stocks, sometimes even globally.
For many smaller investors, this works well.
But this is not how sophisticated investors design their portfolios.
High-net-worth individuals, family offices, private banks, and asset managers have more capital, more access, and more expertise. As a result, they think differently.
How Professional Investors Build Portfolios: The Core
Instead of a strict 60/40 split, professional investors would reduce this ratio to a 50/30 or 50/20 “core”.

The core is built from the same traditional investments often recommended to retail investors. Broad stock exposure and high-quality bonds, very often implemented through ETFs.
The core has a clear job:
Deliver the return of the overall market
Generate income
Provide stability
In industry language - and I will keep jargon to a minimum - this is called “beta”.
Beta is simply the return of the market itself. Nothing fancy. Nothing exciting. Just dependable.
This core is the infantry of the portfolio. Solid. Reliable. Necessary.
And precisely because the core is dependable, it allows professional investors to do something important with the remaining 20-30% of capital. Their mandate is that they must outperform the general market. How do they do it? They deploy specialists.
The Specialists
Specialists are usually referred to as alternative investments.
This is a broad category and can include almost any type of investment, but mostly are hedge funds trading commodities, options, currencies, event-driven strategies, long-short equities, global macro, cryptocurrencies, private equity, etcetera. Some of these funds use leveraged instruments.
Professional investors allocate to these specialists with two clear objectives:
To generate high performance, accepting the higher risk
To generate returns that are uncorrelated to the stock market, helping during downturns
High performance and high risk go hand in hand over the long term. This relationship cannot be broken, and that is perfectly fine. Specialists are meant to take risk.
What matters is how that risk is managed.
Professional investors diversify across many different specialists, reducing the impact of any single strategy.
Outperforming the market is called “alpha”.
So remember this:
Beta equals “boring” market returns
Alpha equals “juicy” returns
You will never forget this distinction.
This combination of a stable core and specialist allocations is known as a Core–Satellite approach to investing.

Where does AlphaScience Fit?
Technically, AlphaScience falls into the specialist category. Although we invest in stocks, we are considered an alternative investment, because of our high-conviction, concentrated strategy.
We sit in the satellite portion of the portfolio.
Our long-term returns outperform the general stock market by a wide margin. In some periods, they are far above the market. By performance alone, we clearly belong with the specialists. We generate true “alpha”.
And critically - we achieve this without using any leverage.
But here is where things become interesting.
The Unusual Part: Risk
Now let’s look at our risk statistics.
Over the long term, AlphaScience has lower risk than the stock market itself. Lower than the very core it is supposed to support.
Read that again.
This is highly unusual.
Most specialist strategies deliver higher returns by taking much more risk. AlphaScience does not.
Our position is therefore unique:
Satellite-level high performance
Core-level risk
Or, using just a little jargon, alpha performance for beta risk.
That combination is rare.
But don’t take my word for it. Let’s look at the proof.
Proof: Performance and Risk
Below is a comparison between AlphaScience, net of all fees, and SPY, a low-cost ETF tracking the entire S&P 500. SPY is a classic core investment. Pure beta.
First, a visual comparison shows how AlphaScience significantly outperforms the core over time. This is exactly what a specialist strategy should do.
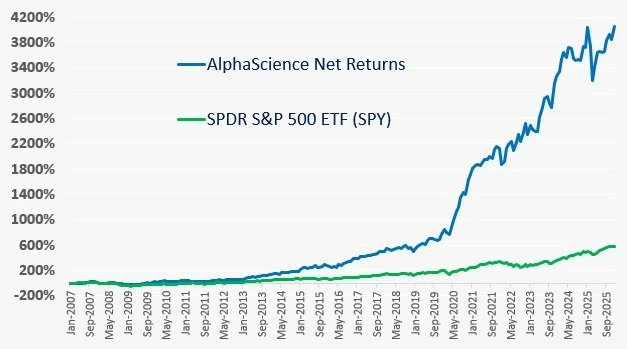
Next, a performance table compares AlphaScience and SPY across several performance metrics, including the percentage improvement over the S&P 500.
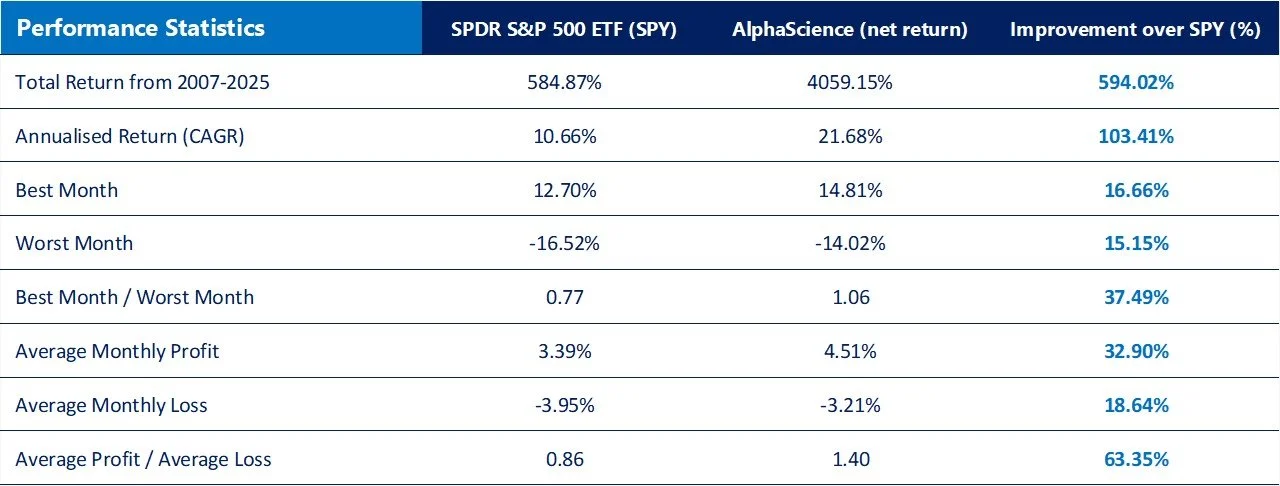
This should not be surprising. Specialists are supposed to outperform.
The final table is where AlphaScience truly stands apart.
It compares AlphaScience and the S&P 500 across multiple risk metrics, showing that AlphaScience achieves its outperformance with much lower risk than the market itself.
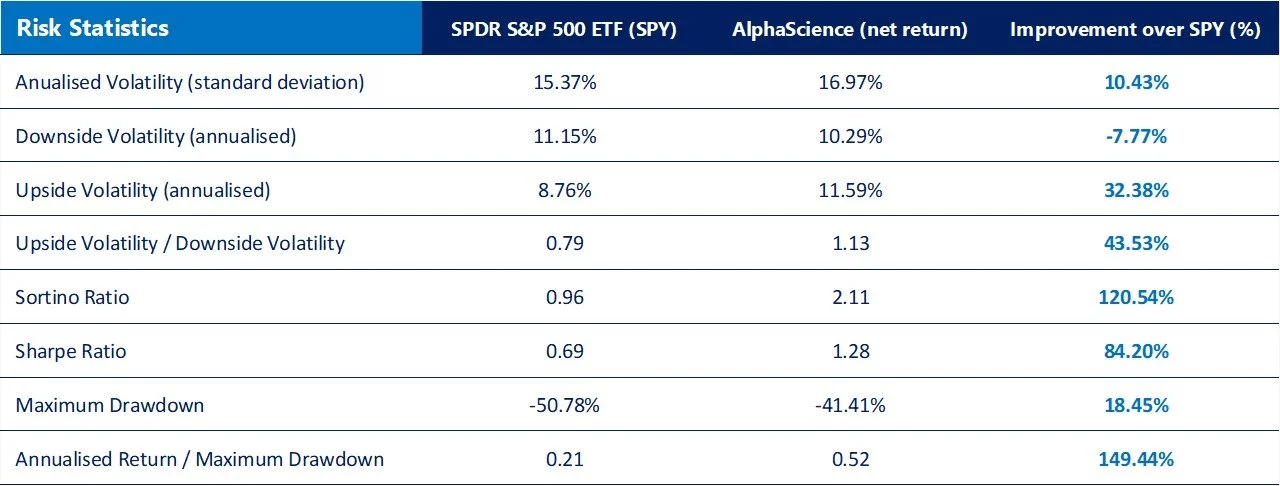
The conclusion is clear.
Satellite-level outperformance with core-level risk.
Know Who You Are
In finance, as in life, there is something powerful about knowing exactly who and what you are.
Wealthy private clients and investment managers are presented with attractive and exciting investment opportunities almost every day.
However, AlphaScience does not compete directly with other specialists – there is a place and a role for many different specialists in the Core-Satellite investment approach.
AlphaScience fits into a very specific niche.
Alpha performance for beta risk.
And that is rare.
Blog written by Etienne Botes
January 9, 2026.
Is Momentum Investing “Predicting” the Market?
From time to time, it can appear that our investment strategy is almost predictive.
The timing of certain market trends, or the way our portfolio aligns with broader developments in the world, can give the impression that our system somehow knew what was coming.
We didn’t.
And more importantly, we don’t need to.

John William Waterhouse – The Crystal Ball (1902)
This distinction matters, because much of the mythology surrounding investing is built on the idea of prediction: forecasting where markets will go, when they will get there, and by how much. Momentum investing is often misunderstood in this context. In reality, it operates on an entirely different principle.
The Human Desire to Predict
Some readers may remember Darren Aronofsky’s 1998 black-and-white film Pi in which the protagonist becomes obsessed with discovering a mathematical formula capable of predicting the future. (Do not watch this film if you are a migraine sufferer.)

The premise taps into a deeply human instinct: if the world is governed by rules, then surely - given enough data and enough computing power - we should be able to foresee what comes next.
Financial markets seem like a perfect candidate for this way of thinking. They are numerical, data-rich, and increasingly shaped by sophisticated technology and artificial intelligence. And yet, markets stubbornly resist prediction.
What Momentum Actually Does
What we do know, as a fact, is that momentum - as a generic investment strategy - outperforms other strategies such as value, quality, growth, dividend, or size factors.
If markets cannot be predicted, why does momentum work?
Because momentum does not rely on foresight - it relies on recent history.
Empirically, assets that have demonstrated absolute and relative strength tend to continue outperforming, at least for a time. This effect has been documented across markets, asset classes, and decades of data. It is not a forecast - it is a statistical tendency.
Crucially, this tendency does not arise in a vacuum.
Every stock price is the result of real decisions made by thousands - often millions - of market participants. Individual investors, institutions, funds, and systematic strategies all express their views, hopes, fears, and predictions through buying and selling. Over time, this collective behaviour leaves a measurable imprint in prices.
When a stock has exhibited sustained strength over the past several months, it reflects persistent demand: capital flowing in repeatedly, often for different reasons and across different time horizons. No single participant knows the future. But their aggregated behaviour creates a probabilistic tendency for trends to persist - sometimes only for another month, sometimes longer.
Momentum does not ask:
“What will happen next?”
It asks:
“Given what has already been revealed through price, what tends to happen next?”
When that persistence fades, the strategy adapts. No prophecy required.

Johannes Vermeer – The Astronomer (1668)
Accuracy Is Not the Same as Success
One of the most counterintuitive truths in investing is that you do not need to be right most of the time to be successful.
In some months - or even in some years - momentum strategies may be wrong more often than they are right and underperform the overall market. And yet, over the long term, they still outperform - often by a significant margin.
Why? Because outcomes are asymmetric. Risk is managed through position sizing and exposure, while profits are allowed to compound. This is not about calling tops or bottoms - it is about letting probabilities and payoff distributions do the work.
The Illusion of Foresight
Prediction is seductive because it appeals to ego. It offers certainty, narratives, and the comforting belief that the future can be known.
Prediction is about certainty.
Investing is about probability.
When a momentum strategy appears prescient - investing in just the right stocks or industries just before a major event - it can create the illusion of foresight.

In reality, the strategy did not know what would happen. The information was already there - in the price data.
Momentum succeeds not by predicting the future, but by respecting uncertainty, managing risk, and allowing probabilities - rooted in collective human behaviour - to work over time.
And in markets, that is more than enough.
However…
Despite everything I have just written, and despite being science-driven portfolio managers, occasionally our AlphaScience system will select stocks which appear to defy any rational explanation.
Then these stocks suddenly go up due to a totally “unexpected event”.
Because maybe, just maybe, there is a little predictive power in the AlphaScience system.
We are acutely aware of confirmation bias and know how easily the human mind can assign meaning where none exists.
But we are human too, and we are willing to leave the door open to the possibility of a little “magic”.
Blog post by Etienne Botes
December 7, 2025.
Exclusivity versus Scale: Why Small is Better
In June this year, Bonhams sold this 1967 Ferrari 275 GTB/4 Berlinetta for $3.6 million.
What makes this car so special?
Well, it’s a Ferrari - that already goes a long way. It’s also beautiful. But the real magic is hidden in that “/4”.

The “normal” Ferrari 275 GTB looks almost identical, but the /4 means two overhead camshafts per cylinder head. In other words: more engineering, more performance, more pedigree - and more rare.
The Economics of Scarcity
Classic cars like this are valuable for many reasons, but one factor dominates them all: rarity.
Rarity creates exclusivity, and exclusivity drives value. It’s the engine behind almost every category of high-end collectible. These cars are scarce because only a few hundred were manufactured - whether due to limited demand, or limited resources.
Today, scarcity becomes desirability.
Real Scarcity vs. Manufactured Scarcity
Contrast that with something I see far too often in the modern world, especially online.
Marketers selling a product - or worse, a PDF book - claiming that only 20 are still available. Nothing is scarce about a digital product that can be replicated endlessly.

This is called “false scarcity.”
I call it “bullshit exclusivity.”
Excuse my language, but you can see how strongly I feel about this.
Starting a relationship with dishonesty is never a great marketing strategy. Sure, scarcity can build urgency, but when it’s fake, it becomes manipulative.
The Fund Management Industry's Obsession with Size
Now, let’s move on to fund managers.
The dream of most managers is simple: grow assets under management.
$1 billion, $10 billion, $20 billion - more is always better. This is the opposite of “exclusivity”.
Because they are trading highly liquid instruments with long holding periods, scaling is theoretically possible. But in practice, many managers eventually have to alter their original strategy to accommodate all that capital.
This is known as style drift, and it often happens because client performance becomes a secondary objective to asset growth.
We’re Doing Something Different
So it may sound strange that we actively intend to stay small. We want to limit the size of our fund and remain a capacity-constrained strategy, open only to a select number of investors.
We hold some of the largest companies in the world in our portfolio - extremely liquid and heavily traded - so it might sound like we’re manufacturing our own version of false exclusivity.
We’re not. Here’s why.
High Conviction Means Hard Limits
We run a high-conviction, concentrated strategy and rebalance monthly. This approach translates into considerable outperformance over the long term. However, this creates structural capacity constraints.
The US side is not a problem at all - these are the most liquid companies on the planet.
Europe is different.
In portfolio management, there’s a rule of thumb: never buy more than 20% of the daily turnover of any stock.
Our research shows that for stocks in the IBEX 35 (Spain) and the MIB 40 (Italy), several dozen companies will breach that rule once we cross roughly €200 to €250 million in assets.
That’s our natural limit. We don’t want to exceed it.
So when we say “exclusive”, there is a good reason for it.
Small On Purpose: the Human Element
There’s also a human reason.
We value direct and personal relationships with clients. Whether they're private investors or small institutional investors, we prefer to build solid and enduring relationships with people.

Because we are normal people. And we like other people.
Staying small allows that.
And honestly, small is nice, thank you very much.
Blog post by Etienne Botes
October 27, 2025.
An All-Time High
When markets are at record levels, it leaves many investors paralysed. Do you invest now - or wait for a pullback? A century of evidence provides a surprising answer that challenges everything your instincts tell you.
I will always associate the phrase “All time high” with my favourite James Bond movie theme from Octopussy.
But the real link today is simple: last week, the S&P 500 and the Nasdaq printed fresh record highs.
And straight away, every financial headline seems to whisper the same warning: This can’t last.
Yet Peter Lynch, one of history’s most successful fund managers, put it better than most:
“Far more money has been lost by investors preparing for corrections, or trying to anticipate corrections, than has been lost in the corrections themselves.”

What the data actually says
If stocks are assets with positive expected returns, new highs aren’t oddities - they’re normal.
Using month-end data since 1926, the S&P 500 set a new high more than 30% of the time.
Over the decades, markets hit a new weekly high roughly one in every three weeks - or, viewed another way, approximately once every 15 trading days since 1950.
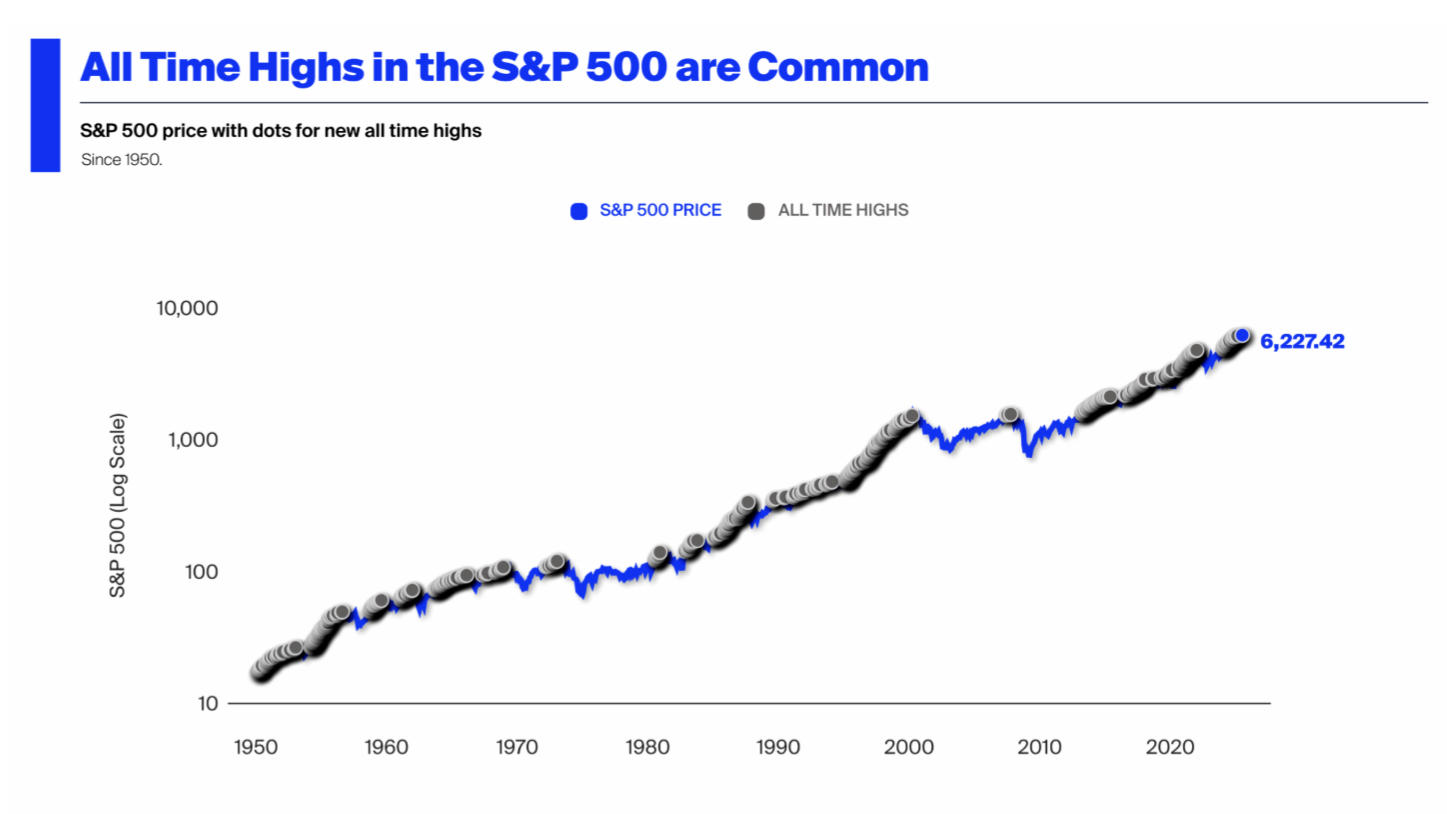
Every single dot on the chart represent a new “all-time high”.
In other words, seeing “record close” on your screen is exactly what you should expect from a market that tends to rise over time. If you’ve been waiting for the “right moment,” you’ve already missed thousands of them.
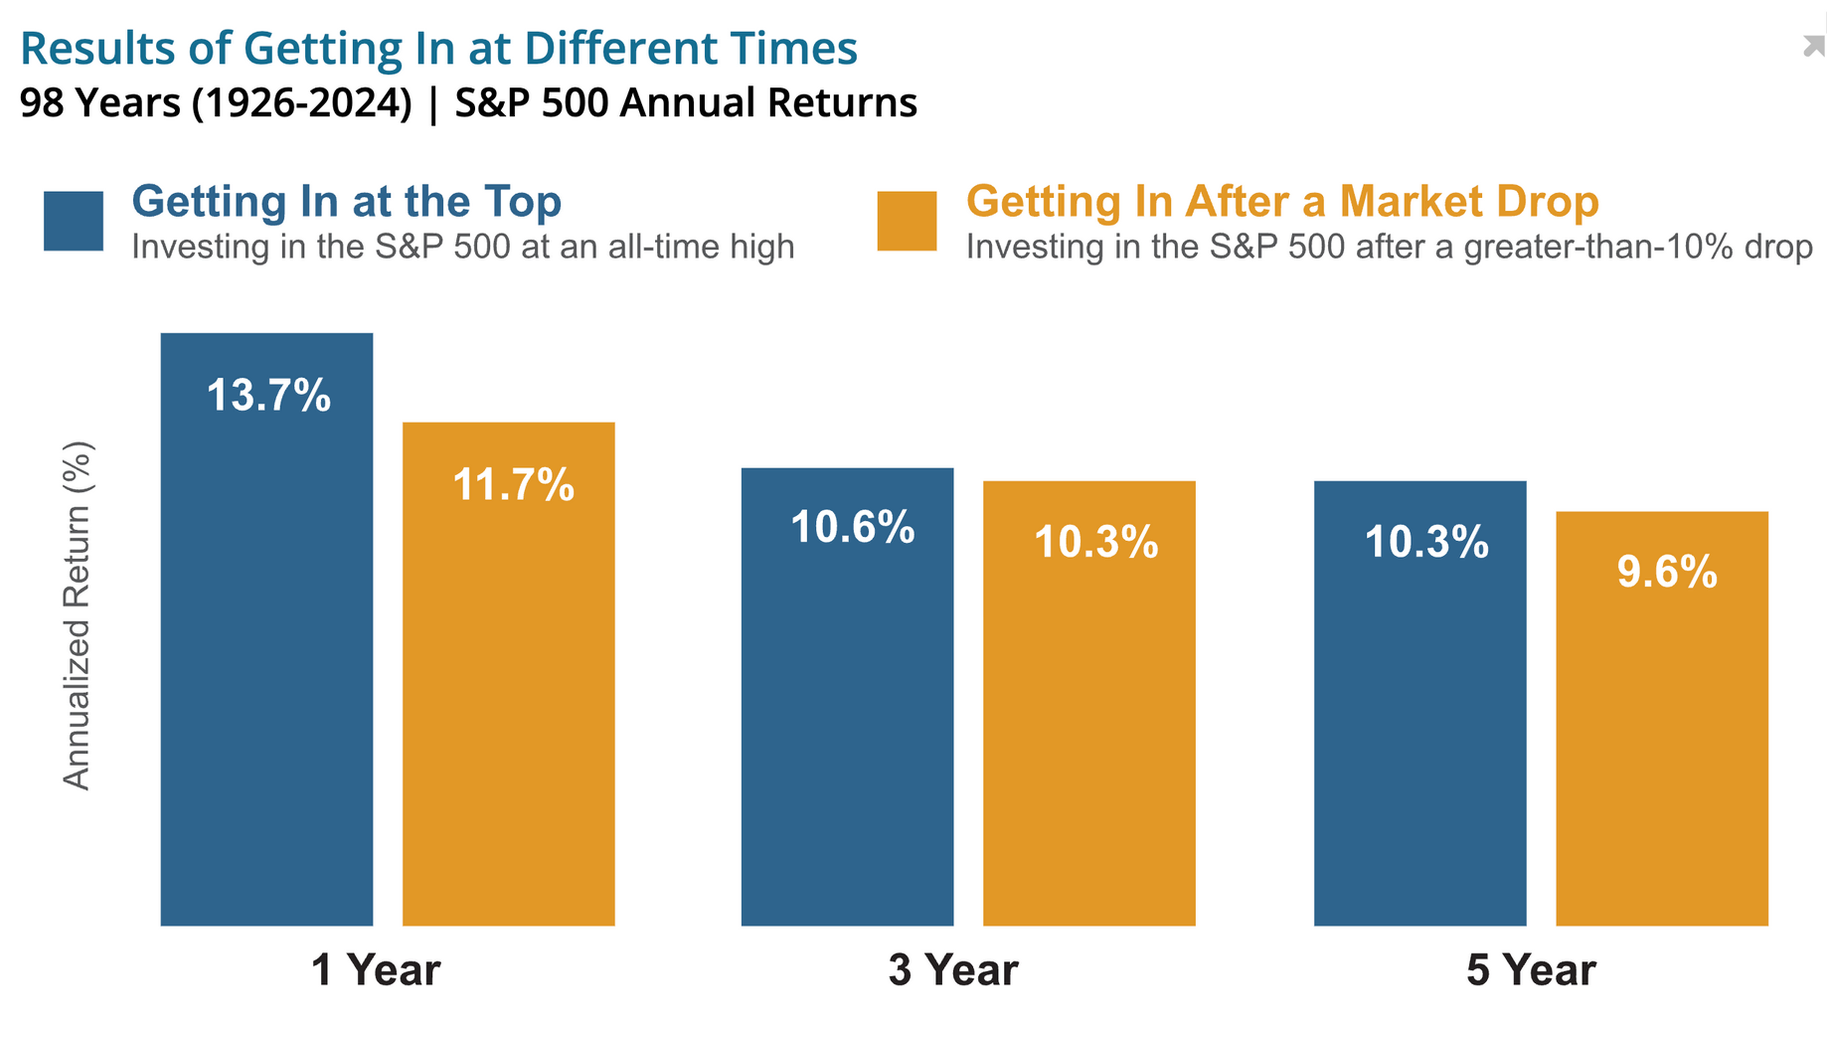
The worry is usually, “Yes, but aren’t returns worse after highs?” The broad evidence says no.
Multiple studies find that buying at record highs has, on average, delivered similar or even better forward returns than buying on a random day - across one- and three-year horizons in the U.S. and globally.
Why “gravity” metaphors mislead
When journalists say markets are “defying gravity,” they’re smuggling in the wrong mental model.
Shares aren’t heavy objects that need effort to stay aloft. They’re perpetual claims on future cash flows. Prices update to reflect that stream - and buyers demand a positive expected return for taking the risk.
If that weren’t true, there’d be no trade. New highs don’t switch off this mechanism; they’re simply mile markers on a long road.

What this means for a serious investor
Treat records with indifference, not excitement or alarm. The temptation to “wait for the dip” often morphs into waiting indefinitely, which is just market timing in slower clothes.
The Aha! moment
To many readers of this blog, the penny is about to drop. Or maybe an anvil.
What this entire article is actually about is… momentum.
The broad market itself exhibits momentum on a large scale and a wide front: strength often begets strength.
Our entire strategy at AlphaScience is based on the same principle of momentum.
Often, our investors must wonder why we are investing in stocks that look as if they’ve already had a tremendous run. Surely they must have run out of steam at this point? Surely they cannot go any higher?
Do you see it’s the same psychological reaction mentioned above - the idea that our intuition is deceiving us?
All the research we have done over the years - proves the same: over the long term, momentum works. Everywhere.
A closing note (with Bond)
As Rita Coolidge sings:
“On an all time high
We'll take on the world and win
So hold on tight, let the flight begin
We're an all time high”
References
Dimensional Fund Advisors (2023) ‘Why a Stock Peak Isn’t a Cliff’, Dimensional Perspectives, 29 September. Accessed 26 October 2025.
Wellington, W. (2021) ‘All-Time-High Anxiety’, Dimensional Perspectives, 24 September. Accessed 26 October 2025.
Carlson, B. (2024) ‘All-Time Highs in the Stock Market are Usually Followed by More All-Time Highs’, A Wealth of Common Sense, 8 February. Accessed 26 October 2025.
Carlson, B. (2024) ‘Investing in Stocks at All-Time Highs’, A Wealth of Common Sense, 12 December. Accessed 26 October 2025.
Blog post by Etienne Botes
September 15, 2025.
(Mis)Timing the Market
A short explainer by our portfolio manager, Victoria Roberts.
Not having a crystal ball must surely rank as one of the great inconveniences of an investor’s life. The decision of when to commit capital - or when to divest - is the subject of endless debate, analysis and hand-wringing.

A Story of Missed Opportunities
Every so often you hear a story that perfectly captures the folly of market timing.
A colleague of mine in the asset management industry told me one such tale, and it has stuck with me ever since.
It begins with an equity fund trying to raise capital. They engaged a well-connected introducer who promised access to a network of “sophisticated” investors.
At the time, markets had staged a powerful rally - nearly 98% above the COVID-19 lows. Yet over several months, whenever they asked the introducer about progress, his answer was consistently:
“Investors think equities are overpriced. They’re waiting for the coming bear market.”
Time passed. The market climbed another 49% over the next five months before stocks eventually came off over the following year by about 30%.
When they checked in again with the introducer, his view had shifted: markets were now “too weak” and clearly in dangerous territory.
Again, the “wrong time” to invest.
You already know the punchline.
The market trended solidly from that point on to fresh highs within seven months.
It’s almost as if investors are hardwired to do the wrong thing: hesitating when they should commit, selling when they should hold.
And this tendency is not confined to private investors. Large endowments, pension funds and even hedge funds fall into the same trap.
Barton Biggs captured this well in his book Hedgehogging when he said: “It must be chic to be contrarian.”
Craig Callahan’s excellent book Unloved Bull Markets expands on this theme, chronicling how investors consistently find reasons not to invest - and are almost always wrong.
The True Cost of Market Timing
The data on timing the market is truly sobering. Even though we are acutely aware of this phenomenon, it still blows my mind. Consider a simple example. If you had invested in the S&P 500 Total Return Index from January 2007 to August 2025:
A $1,000,000 investment would have grown to $6,543,389.
Miss just the 10 best days - out of roughly 5,000 trading days - and the return falls to $2,910,992. That’s a $3.6 million opportunity cost.
Miss the 40 best days and returns actually turn negative.
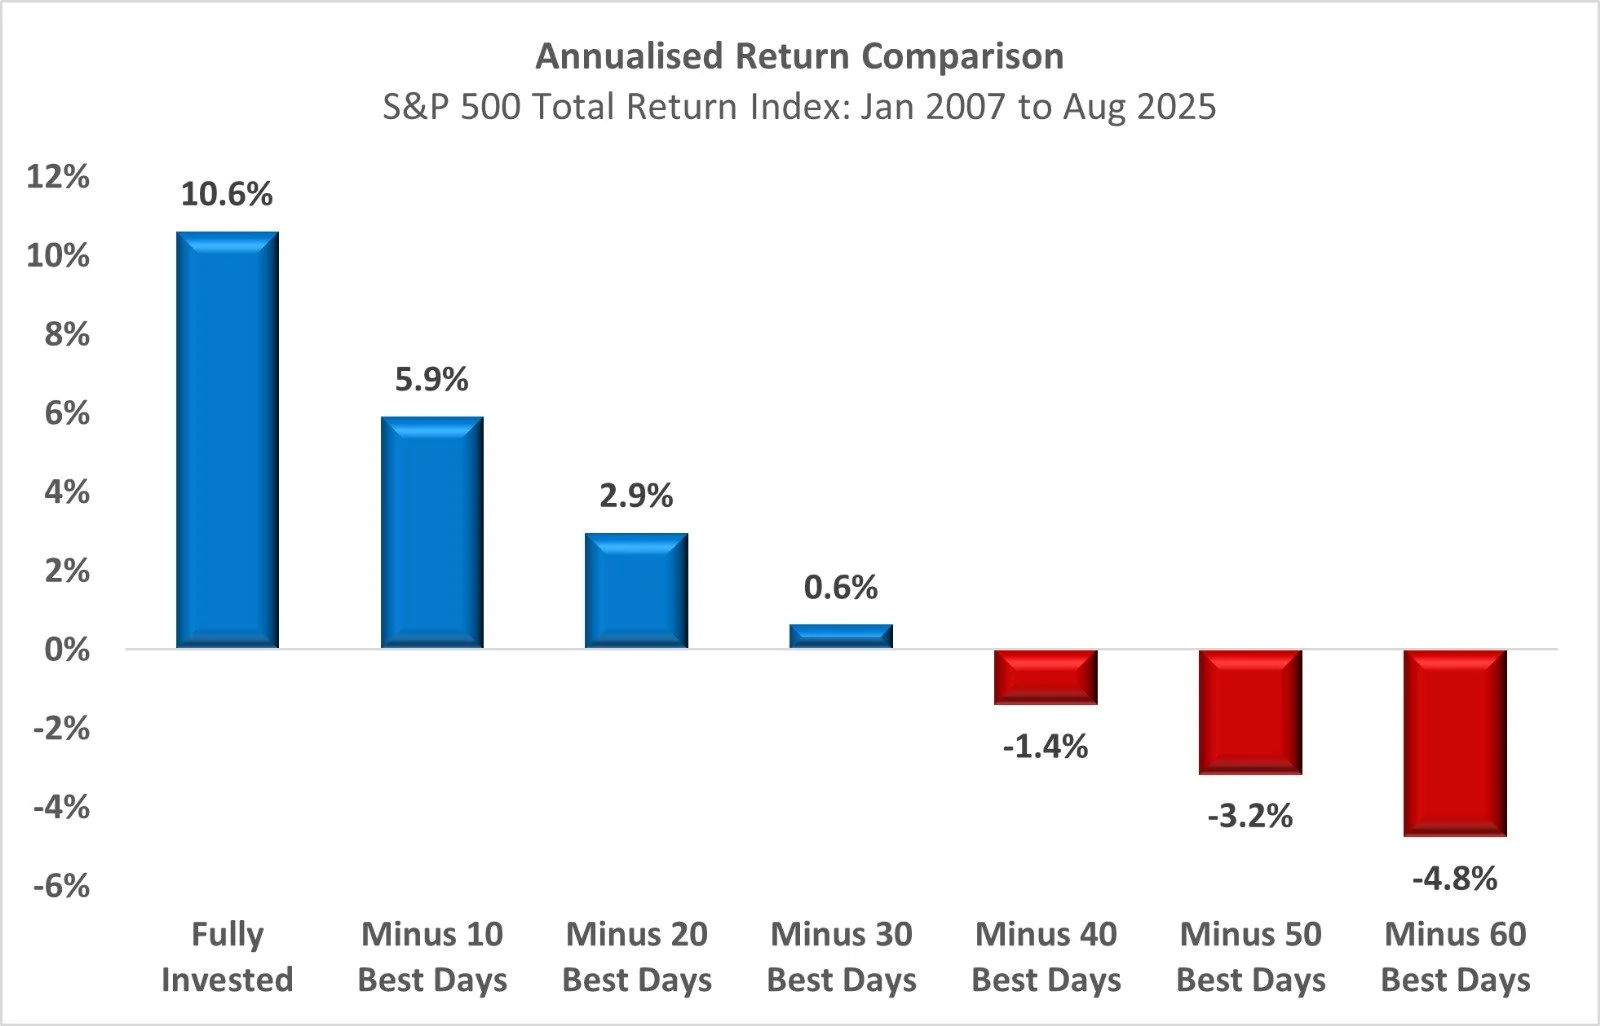
The cruel irony? Many of those “best days” occurred during periods of extreme market stress - precisely when investors tend to pull out, waiting for a clearer signal to re-enter. Taking again the example of the S&P 500 from 2007 to August 2025:
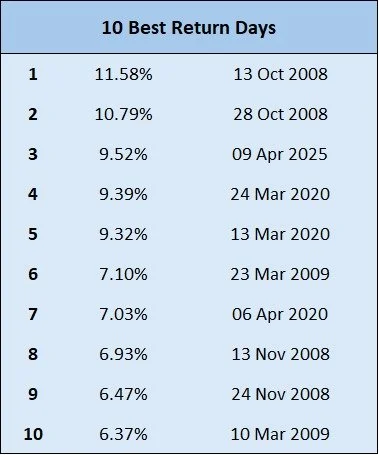
6 of the 10 best days occurred in 2008-2009 during the financial crisis.
3 of the 10 best days occurred in March-April 2020 immediately after the Covid-19 market crash.
One of the 10 best days is particularly fresh in our memories: 9 April 2025. Stocks suddenly surged when President Trump paused tariffs after a few tumultuous months.
The effect is equally striking in our own AlphaScience quantitative strategy. Since 2007, the annualised net return stands at 21.45%. But if an investor had missed just the single best month of each year, their annualised return would have been halved to 11.52%.
Recovery and Perspective
Looking back, the sharpest “crisis events” fade in significance when set against the backdrop of sustained recoveries and long-term bull markets. Each downturn, no matter how severe, has eventually given way to new highs.
Trying to perfectly time the bottom - or capture the exact market top - is usually a losing proposition. Even being just a few days early or late can significantly diminish long-term returns.
The Takeaway
The lesson is clear. There is no “ideal” moment to invest. Not even the smartest, best-informed investors can consistently predict turning points.
The only strategy that truly endures is simple - yet difficult to practice:
Have the courage to invest today.
Stay invested for the long term.
The old adage is more than a cliché - it is the cornerstone of compounding wealth:
It’s time in the market, not timing the market, that drives returns.
Blog post by Victoria Roberts
September 9, 2025.
This is not a stock chart
A lesson in financial markets by René Magritte.
My partner, Christian - an art connoisseur with a sharp eye for metaphor, recently sent me an image of René Magritte’s famous painting: The Treachery of Images.

Most will recognize it immediately. It’s the simple depiction of a pipe with the words “Ceci n’est pas une pipe” (“This is not a pipe”) written beneath.
At first glance, it seems like a joke. Of course it’s a pipe. But Magritte’s point was subtle and profound: we are not looking at a pipe, but at a picture of a pipe. A representation, not the thing itself.
Finance as Representation
This distinction between reality and representation is not confined to the world of art. It is central to the world of finance.
When we look at a price chart of Nvidia - or any company - we are not seeing the company itself.
We are not seeing semiconductors, earnings reports, or balance sheets. What we see is a graphical imprint of human behaviour. It is a chart of people - their hopes, fears, greed, optimism, pessimism, and herd instincts - aggregated into price action.
Price Behaviour, Not Companies
In this light, price behaviour takes on a new dimension. Every rise or fall in the market is not simply a reflection of fundamentals, but of how thousands of participants collectively perceive and react to information.
These behavioural patterns repeat because human psychology repeats. Prices move in cycles of fear and greed, confidence and doubt, euphoria and despair.
The Role of Fundamentals
Does this mean fundamental analysis is irrelevant?
Not at all.
Investors like Warren Buffett have built fortunes on the disciplined study of fundamentals. But as we often point out, Buffett’s success is inseparable from his time horizon - he can afford to hold forever - and from the resources of an army of analysts working for him.
For the rest of us, the reality is different. Even the most rigorous fundamental analysis eventually expresses itself through human behaviour - because analysts, portfolio managers, and retail investors alike must make buy and sell decisions. And when they act, those decisions show up in price behaviour.
Why Behavioural Finance Matters
This is why behavioural finance is so powerful, yet still underappreciated. Prices are not cold reflections of fundamentals: they are living expressions of perception.
In the short to medium term, perception frequently trumps reality.
Herding behaviour, fear of missing out (FOMO), and irrational exuberance can inflate prices well beyond reason - as history reminds us, from Dutch tulips to dot-com stocks to housing bubbles.

Momentum as Financial Behaviour
Momentum investing - the cornerstone of our approach at AlphaScience - sits precisely at this intersection.
Momentum is nothing more than the systematic measurement of financial behaviour over time.
Guarding Against the Crowd
But momentum must be used with care.
Just as crowds can be rational, they can also be disastrously wrong. Herding can drive bubbles, and bubbles can burst.
At AlphaScience, we take steps to reduce these risks: focusing on large-cap stocks, rebalancing monthly, and deploying our proprietary AlphaScience System.
The system uses seven carefully designed metrics to analyse daily price behaviour over several months, “sniffing out” authentic momentum while filtering out irrational excess.

A Final Reflection
Ultimately, the insight is both simple and profound: price charts are not about companies - they are about people.
Every movement is the sum total of human judgment, emotion, and behaviour. If you can read that behaviour, you can invest not only in stocks, but in the psychology of markets themselves.
As Magritte might have said: “This is not a stock chart.”
It is a portrait of all of us, as market participants, whose collective decisions create the picture we see.
Blog post by Etienne Paul Botes
August 11, 2025.
The Market That Refuses Logic
Why the world’s most unloved bull market might be the best argument for disciplined investing.

An Unstoppable Rally — Or Just an Unexplained One?
In the last five years, the U.S. stock market has shrugged off a pandemic, the worst inflation in 40 years, interest rates at 20-year highs, and a set of economic policies from Washington that most economists consider - to put it politely - counterproductive.
From 2019 to 2024, the S&P 500 grew at nearly twice its historical average. In 2025, it’s already up about 8%, despite tariffs at century highs, labour shortages, fiscal uncertainty, and a debt ceiling drama lurking in the background.
The dissonance is striking: bad headlines, good markets.
Theories, Theories Everywhere
Over the past few years, market watchers have cycled through a rotating cast of explanations. Each sounds compelling - until reality changes the plot:
The Fundamentals Story
Stocks reflect future earnings, they said. Except corporate earnings growth hasn’t been spectacular enough to explain valuations at these levels.The Liquidity Story
Easy money from the Fed lifted all boats after 2008 and during COVID. But since 2022, the Fed has drained liquidity and hiked rates - and yet, markets surged anyway.The AI Narrative
The “Magnificent Seven” mega-caps have delivered eye-watering gains on the back of the AI revolution. Nvidia’s valuation alone defies conventional math. Is this transformative innovation - or 1999 with better branding?The TACO Trade (Trump Always Chickens Out)
The idea: fade every tariff threat, because policy will be watered down to spare the market. Trouble is, tariffs are in fact at record levels, and still the market marches higher.The Passive Investing Effect
With half of U.S. fund assets now in passive vehicles, index buying is relentless. That mechanical demand pushes valuations higher, concentrates capital in the largest companies, and dampens the market’s sensitivity to bad news.
Each theory explains part of the picture. None explains all of it.

Bad Policy, Strong Market
Economists almost universally agree: the current administration’s trade and budget policies are a long-term drag on growth. Tariffs, deportation-driven labour shortages, and deep cuts to research funding are not recipes for lasting prosperity.
And yet… the immediate GDP hit from even aggressive protectionism is modest. Yale’s Budget Lab estimates a long-run drag of 0.4% - meaningful, but hardly catastrophic in the short term. Meanwhile, the AI buildout is turbocharging capital investment, propping up growth that might otherwise have stalled.
It’s not that the market is ignoring bad policy - it’s that short-term optimism about AI is overpowering medium-term concerns.
The Unloved Bull
If this were a textbook bull market, you’d expect widespread enthusiasm. Instead, scepticism is everywhere:
Short interest in major ETFs is rising.
Hedge fund leverage is below average.
Leveraged long funds are seeing outflows, while inverse products gain assets.
Consumer sentiment is near historic lows.
And yet, every sharp pullback has been followed by a sharper rebound. The bears keep stepping in front of the proverbial steamroller - and the steamroller keeps winning.

When Even the Experts Can’t Agree
What do you do when fundamentals don’t align with prices, liquidity isn’t the driver, and the dominant market story might be a bubble in disguise?
You could try to pick the right narrative, time the inevitable correction, and position accordingly. But history suggests that even the most experienced professionals, with armies of analysts and data models, tend to get this wrong more often than right.
It would appear that pessimism is increasingly a permanent psychological bias in human financial behaviour. Bad news gets more attention than good news because pessimism is often wrapped in intellectually profound analysis, while optimism can seem simplistic.
Even in publishing, books about economic doom and disaster far outsell those about optimism and market growth - bad news sells.
Paul Samuelson once joked that the stock market had predicted nine of the last five recessions. That was true then, and it’s truer now.
Our Take: Process Over Prediction
At AlphaScience, we don’t pretend to know whether the AI boom will keep going, whether tariffs will trigger a recession, or whether the Magnificent Seven will become the next Nifty Fifty.
We don’t try to divine the market’s mood - because moods can change faster than policy, and faster than portfolios can react.
Instead, we rely on our AlphaScience System:
Systematic: Every month, it selects the stocks with the strongest momentum characteristics.
Unemotional: No macro guesswork, no gut feel, no “what if” paralysis.
Empirical: The process is grounded in years of rigorous testing and performance data.
We believe - and have demonstrated - that disciplined, rules-based investing outperforms over the long term, not because it predicts the market’s reasoning, but because it sidesteps the temptation to try.
Final Word
Let’s be clear: we are not suffering from “irrational exuberance” in the stock market. We are not chronic optimists about the enduring bull-bias in equities. We are not in self-denial about the existence and inevitability of bear markets.
But we are absolutely against the notion - so often embraced by chronic pessimists - that second-guessing the stock market is a viable strategy. Too many investors miss out on strong returns in a vain attempt to time the market.
Markets don’t have to make sense for them to make money.
What matters for serious investors is not why the market is going up, but how to capture its gains without falling prey to the seductive but dangerous game of over-explanation.
In an era where the market refuses to listen to conventional wisdom, perhaps the wisest move is not to talk - but to act, with discipline.
Author’s note: The events described in this article may be specific to this moment in history - however, the results and conclusions about financial behaviour will happen again, and again, and again.
References
Edwards, J. (2022) Unloved Bull Markets: Getting Rich the Easy Way by Riding Bull Markets. Hoboken, NJ: Wiley.
Budget Lab at Yale. 2025. State of U.S. Tariffs: August 7, 2025. [online] Available at: https://budgetlab.yale.edu/research/state-us-tariffs-august-7-2025 (Accessed 10 Aug. 2025)
Bloomberg News (2025) ‘Battered Wall Street “short brigade” is refusing to admit defeat’, Bloomberg, 16 May. Available at: https://www.bloomberg.com/news/articles/2025-05-16/battered-wall-street-short-brigade-is-refusing-to-admit-defeat (Accessed: 10 August 2025).
Thompson, D. (2025) ‘The search for stock market theories that actually explain something’, The Atlantic, 5 August. Available at: https://www.theatlantic.com/economy/archive/2025/08/stock-market-theories/683780/ (Accessed: 10 August 2025).
Krugman, P. (2025) ‘About that stock market’, Paul Krugman | Substack, 8 August. Available at: https://paulkrugman.substack.com/p/about-that-stock-market (Accessed: 10 August 2025).
Blog post by Etienne Botes
July 24, 2025.
Momentum Myth Busting: Transaction Costs
When you pause and reflect, it’s actually quite extraordinary to have lived through the last few decades in the financial markets. Because thanks to relentless innovation and technology, everything feels new - almost like we're only at the start of a new era in finance.
This sense of novelty extends even to our own core investment philosophy: momentum investing.
A Quick Refresher: What Is Momentum Investing?
Momentum investing is a remarkably logical idea: stocks that have outperformed their peers (the “winners”) tend to keep outperforming. It’s the simple tendency for assets in motion to stay in motion - until they don’t.
Despite the momentum effect being present for over a century, it wasn’t until a landmark academic paper in 1993 that the concept received proper recognition. That paper opened the floodgates: over the ensuing decades, a vast body of academic research has confirmed the superiority of momentum over many other investment styles.
Naturally, as night follows day, some academics pushed back against the outperformance of momentum investing - on the grounds of transaction costs.
The Academic Debate: Does Momentum Fall Apart Under Trading Costs?
Critics argue that high turnover makes momentum investing fragile. Because momentum managers frequently refresh their portfolios - selling stale trades and rotating into newly strong names - they rack up trading costs. These costs, the argument goes, can erode or even eliminate any edge momentum has over simply investing in the index.

But here’s the beauty of peer-reviewed research: almost every paper has a counter-paper.
Another growing camp of academics insists this fear is outdated. Yes, in the “good old days” when a round trip cost 1.7–2%, momentum's advantage might have been wiped out. But today?
Institutional trading fees are often as low as 0.1–0.2%. And thanks to smart execution techniques and vastly improved liquidity, those costs are far less destructive.*
Here's the Real Question
Rather than asking whether momentum as a concept is vulnerable to trading costs, the real question should be:
How vulnerable is the implementation of a specific momentum strategy to transaction costs?
And to be perfectly honest, that's the whole point of this blog post - to demonstrate how utterly pointless the theoretical debate over transaction costs can be when viewed in the context of an actual, real-world strategy.
Let’s Look at the AlphaScience Momentum Strategy
Graph 1: Our Momentum Strategy - Clean and Simple
Take a look at Graph 1. This represents the performance of the AlphaScience U.S. strategy, which draws from a universe of Nasdaq-100 and S&P 100 stocks.
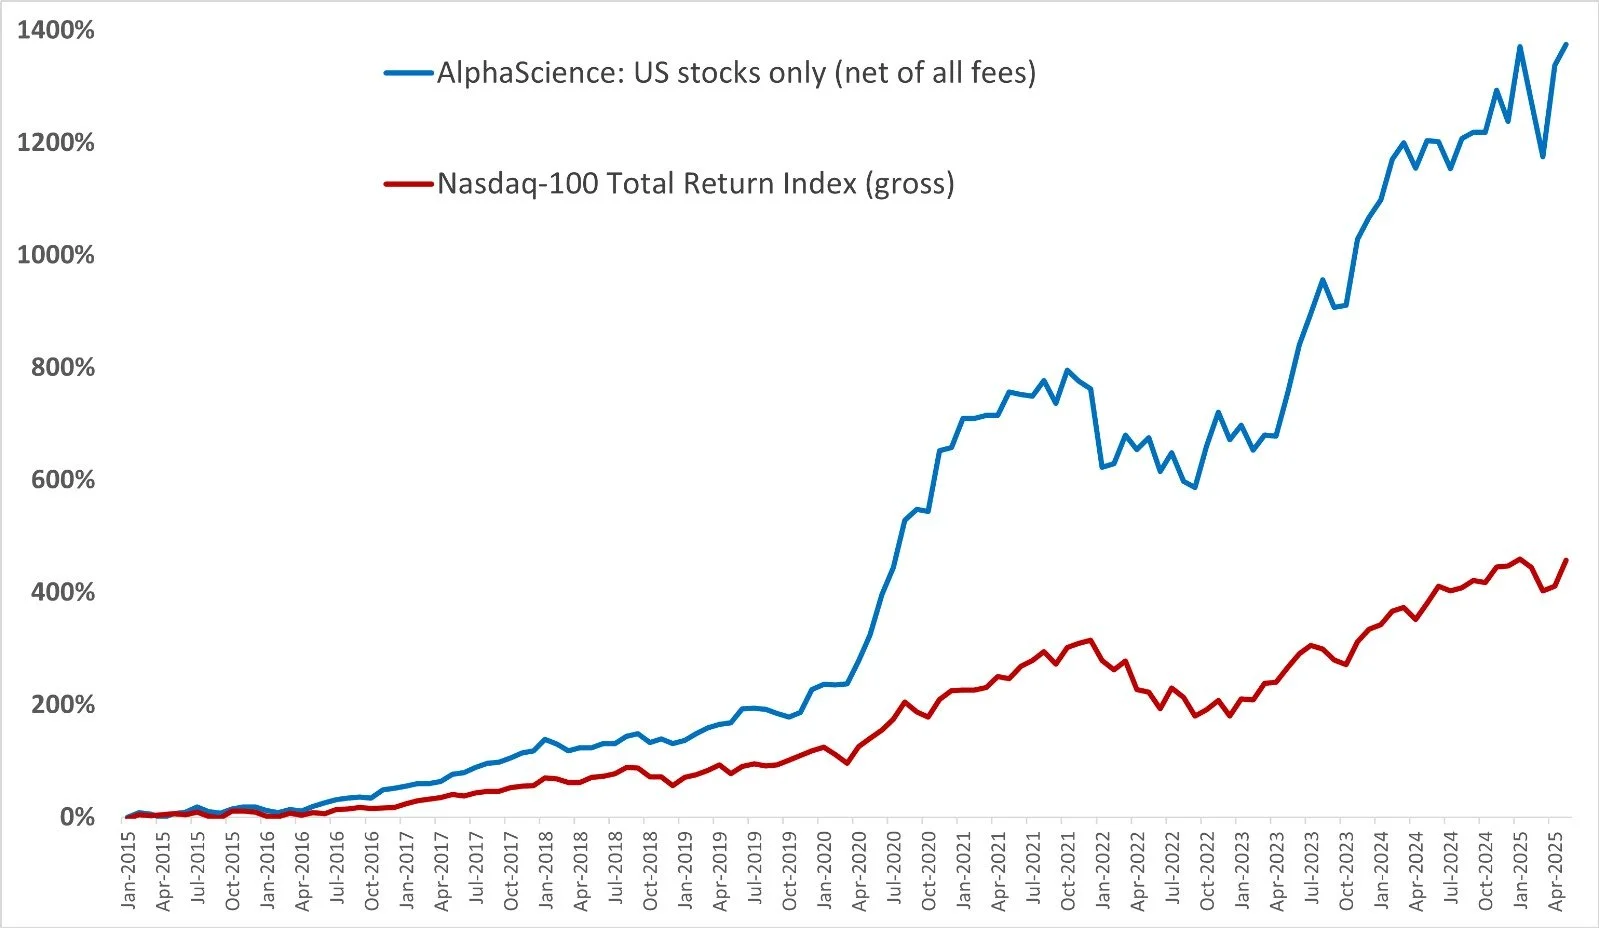
Graph 1.
The results are based on the closing prices on the last day of each month - an idealized reference point, yes, but a necessary one. And while you might argue that such precision is unrealistic in practice, it's more relevant than you might think: most trading volume - and thus liquidity - occurs near the close.
But even if you disagree, stay with me. Because this is where it gets interesting.
Graph 2: What Happens When We Include Transaction Costs?
In Graph 2, we apply a blanket 20 basis point round-trip trading cost to our strategy. Unsurprisingly, the performance drops by about 2.4% per year. That's the most obvious and dumb analysis one can possibly do.
But here’s the thing: this is not how trading works in real life.
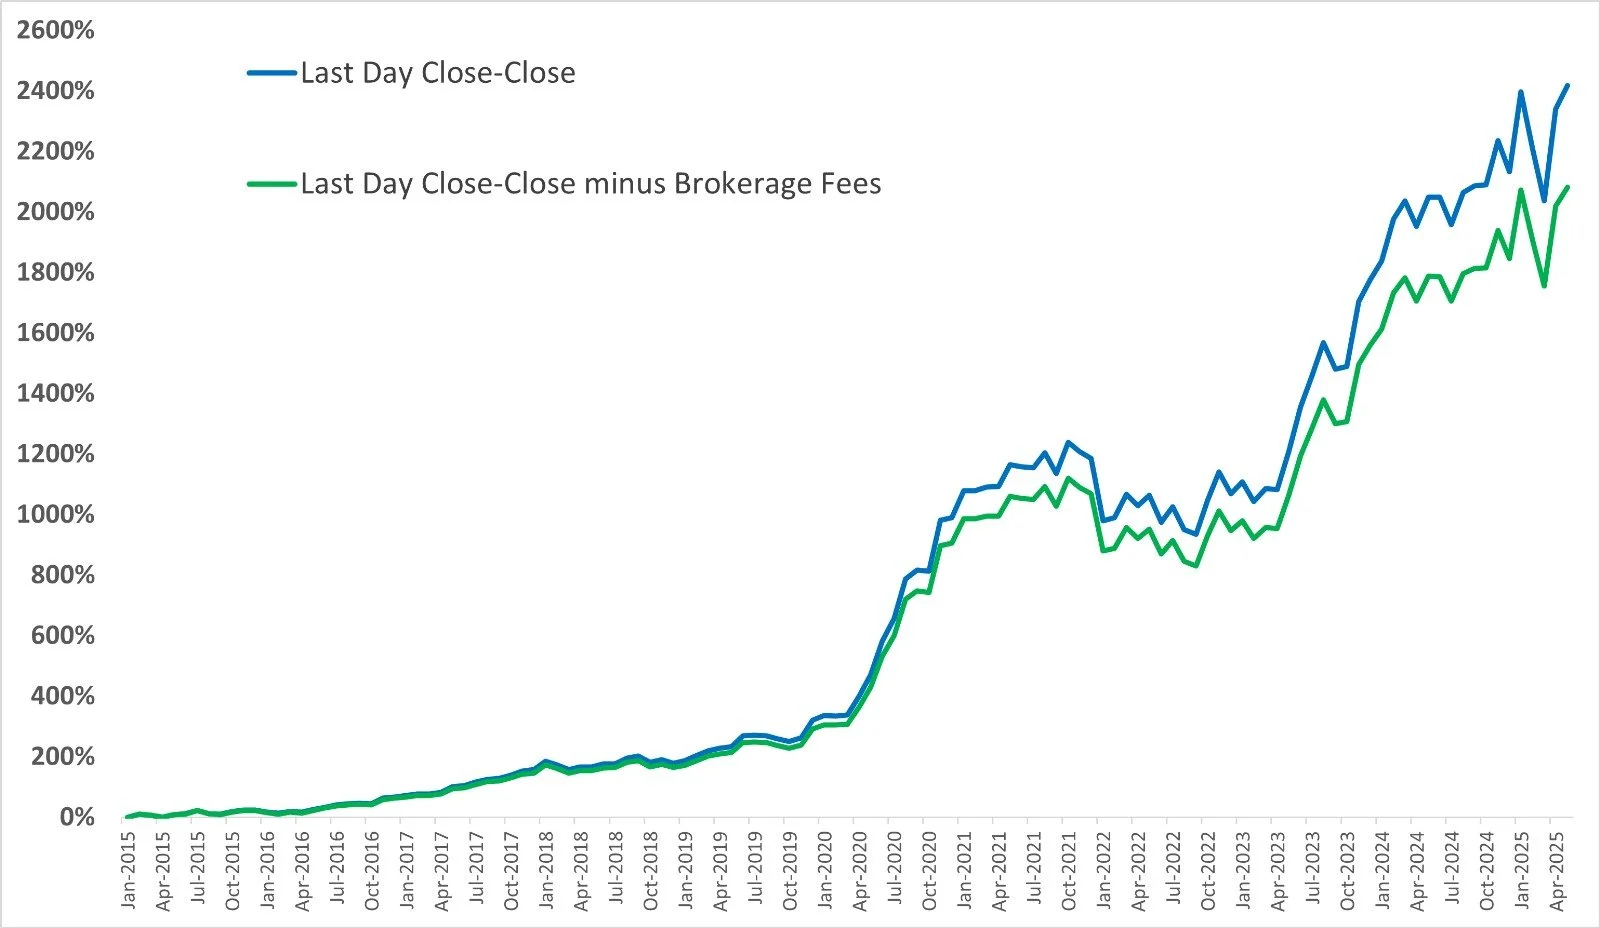
Graph 2.
Real World vs. Theory: The Monster Beverage Example
Let’s say we’re buying Monster Beverage Corp [MNST] at the end of June 2025.
The closing price was $62.64
Add a 0.1% fee → effective price: $62.70
But what if the stock had been bought just 15 minutes earlier? Then the price might have been $62.58 → effective price including fees: $62.64
Or maybe it was bought at the high of that bar: $62.67 → effective with fees: $62.73
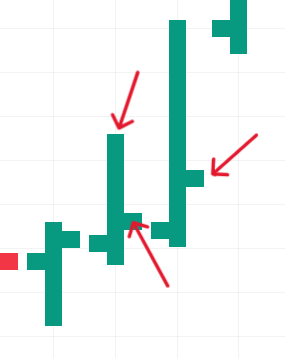
MNST 15-minute chart
The point? Execution timing matters more than the 0.1% fee. In many cases, the fee becomes noise.
How Robust Is Our Strategy to Timing?
Graph 3: Sensitivity Analysis
To test the robustness of our monthly portfolio rebalancing strategy, we simulated different entry and exit scenarios.
In the first test, we assumed each stock was bought at the closing price on the last day of the month and sold at the closing price on the last day of the following month.
We then ran additional simulations using the closing prices from the second-last and third-last trading days of each month. For each of these scenarios, we also tested using the mid-range price, calculated as the average of the day’s high and low prices.
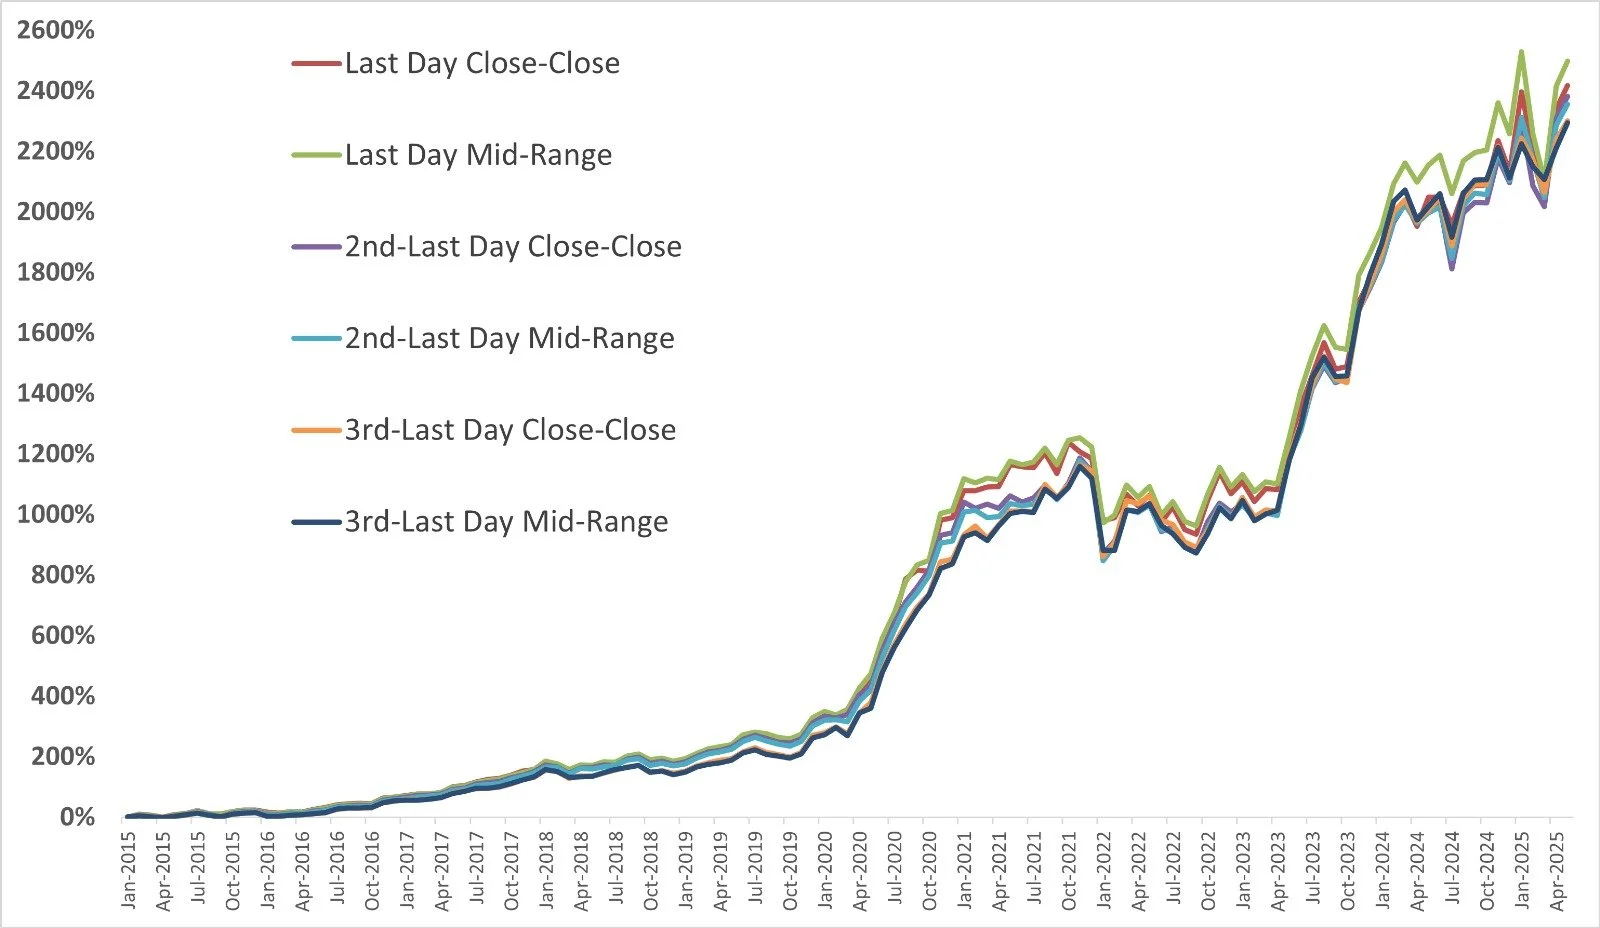
Graph 3.
The result? All equity curves looked nearly identical. That tells us something powerful: our strategy is not sensitive to small timing or cost variations. It’s robust. It holds up.
We Go Further to Reduce Friction
Our design decisions intentionally reduce cost exposure:
We trade only large- and mega-cap equities in the U.S. and Europe. Mid-cap and small-cap stocks have higher trading costs
We avoid short selling, which adds cost and complexity
We don’t fully change our stocks every month - stocks can and often do persist in the portfolio across multiple periods

Why Do People Still Obsess Over Fees?
If transaction costs aren’t such a big deal, why do people still focus so much on them?
1. Retail Psychology and Marketing
"Zero-commission" trading is easy to market. Platforms like Robinhood have gamified trading and advertised "free" investing. For individual investors, brokerage fees are tangible and visible, while price slippage is less obvious. Sometimes, it's just legacy thinking - people still talk about fees because it used to matter more when commissions were 1–2% per trade (before the 2000s).
2. High-Frequency Traders
For market makers and HFTs making millions of trades, tiny costs matter. They have to optimize every basis point to survive. They obsess over microscopic costs because it directly affects their statistical edge.
3. Mutual Funds and Large ETFs
Large mega-funds running momentum strategies often scrape out a small edge over the benchmark. For them, even small costs can matter because their relative advantage is small to begin with.
Final Thoughts: Don’t Worry About the 0.1%
Yes, it’s prudent for any portfolio manager to negotiate the lowest trading fees possible. But here’s what matters more:
Can the strategy withstand variations in execution, price and cost? Or does it fall apart if a trade is delayed or the fee is slightly higher?
If the answer is the latter, the strategy is fragile - and that’s a much bigger concern than 0.1%.
We’ve tested and retested our approach, and the conclusion is clear: our strategy remains strong regardless of small changes in cost or timing.
* References
Hoffstein, C., 2018. Two centuries of momentum. Newfound Research.
Hurst, B., Ooi, Y.H. and Pedersen, L.H., 2017. A century of evidence on trend-following investing. The Journal of Portfolio Management, 44(1), pp. 15-29.
Dennehy, B., 2021. The history of momentum investing – Two centuries of pedigree.
Geczy, C.C. and Samonov, M., 2016. Two centuries of price-return momentum. Financial Analysts Journal, 72(5), pp. 32-56.
Jegadeesh, N. and Titman, S., 1993. Returns to buying winners and selling losers: Implications for stock market efficiency. The Journal of Finance, 48(1), pp. 65-91.
Korajczyk, R.A. and Sadka, R., 2004. Are momentum profits robust to trading costs? The Journal of Finance, 59(3), pp. 1039-1082.
Lesmond, D.A., Schill, M.J. and Zhou, C., 2004. The illusory nature of momentum profits. Journal of Financial Economics, 71(2), pp. 349-380.
Agyei-Ampomah, S., 2006. The post-cost profitability of momentum trading strategies: Evidence from the UK. Journal of Business Finance & Accounting, 34(1-2), pp. 141-167.
Asness, C.S., Frazzini, A., Israel, R. and Moskowitz, T.J., 2014. Fact, fiction, and momentum investing. The Journal of Portfolio Management, 40(5), pp. 75-92.
Frazzini, A., Israel, R. and Moskowitz, T'Connor, J., 2015. Implementing momentum: What have we learned? AQR Capital Management.
SGH/EAM Investors, 2015. Momentum and trading costs.
Israel, R., Moskowitz, T.J., Ross, S.A. and Serban, L., 2017. The costs of implementing momentum strategies. Alpha Architect.
Korajczyk, R.A. and Sadka, R., 2004. Are momentum profits robust to trading costs? The Journal of Finance, 59(3), pp. 1039-1082.
Blog post by Etienne Botes
June 20, 2025.
The Research That Changed Everything: The Absolute Proof
We don’t just see ourselves as portfolio managers - we think of ourselves more as scientists of the financial markets. No, we’re not “scientists” in the strict sense, but we are constantly immersed in the scientific method.
Because of that mindset, we rarely fall off our chairs from a surprise finding.
But this research came close.
When you manage client capital, you have to be certain you're doing the right thing. And if you’re anything like us (slightly obsessive), you're constantly checking, verifying, and retesting your assumptions - that nagging feeling that you might have missed something never quite goes away. You must always question your own findings.

Don’t worry, this is not what our office looks like, but you get the idea about being “obsessive”.
A Quick Recap: We’re Momentum Investors
Let’s start with the basics: our strategy falls squarely within the realm of momentum investing.
A reminder: momentum is the remarkably logical phenomenon that stocks which have performed well relative to peers (winners) will generally continue to outperform. It is the tendency of stocks to continue to trend in the same direction once they are in motion.
There is a mountain of research from both the industry and academia proving that momentum exists - across all markets, over centuries, and in every major country.
But even with all that, we still had to ask: What if we tested it our way? This simple research we’ve done some years ago may be the most definitive proof we’ve ever seen that momentum is real.
This might be our most important blog post. Get ready to have your mind blown.
Step One: Start With the Nasdaq 100
Let’s keep it simple. We’ll use the Nasdaq-100 as our stock universe for this experiment. We use both the Nasdaq-100 and the S&P 100 in our system - but for this experiment, you could use almost any major stock index.
A quick reminder: the Nasdaq-100 is already a form of momentum system in disguise - because stocks get added to it based on their growing market capitalisation. In other words, to even make the list, a stock already has to have been going up, and up, and up. So we’re selecting from a group of thoroughbred racehorses.
Figure 1 shows the Nasdaq-100 from 2007 to date. Not bad as an investment, right? (Don’t tell the hedge fund industry this, but if you simply bought a Nasdaq-100 ETF like the QQQ in 2007, you would have outperformed the majority of hedge funds. I kid you not.)
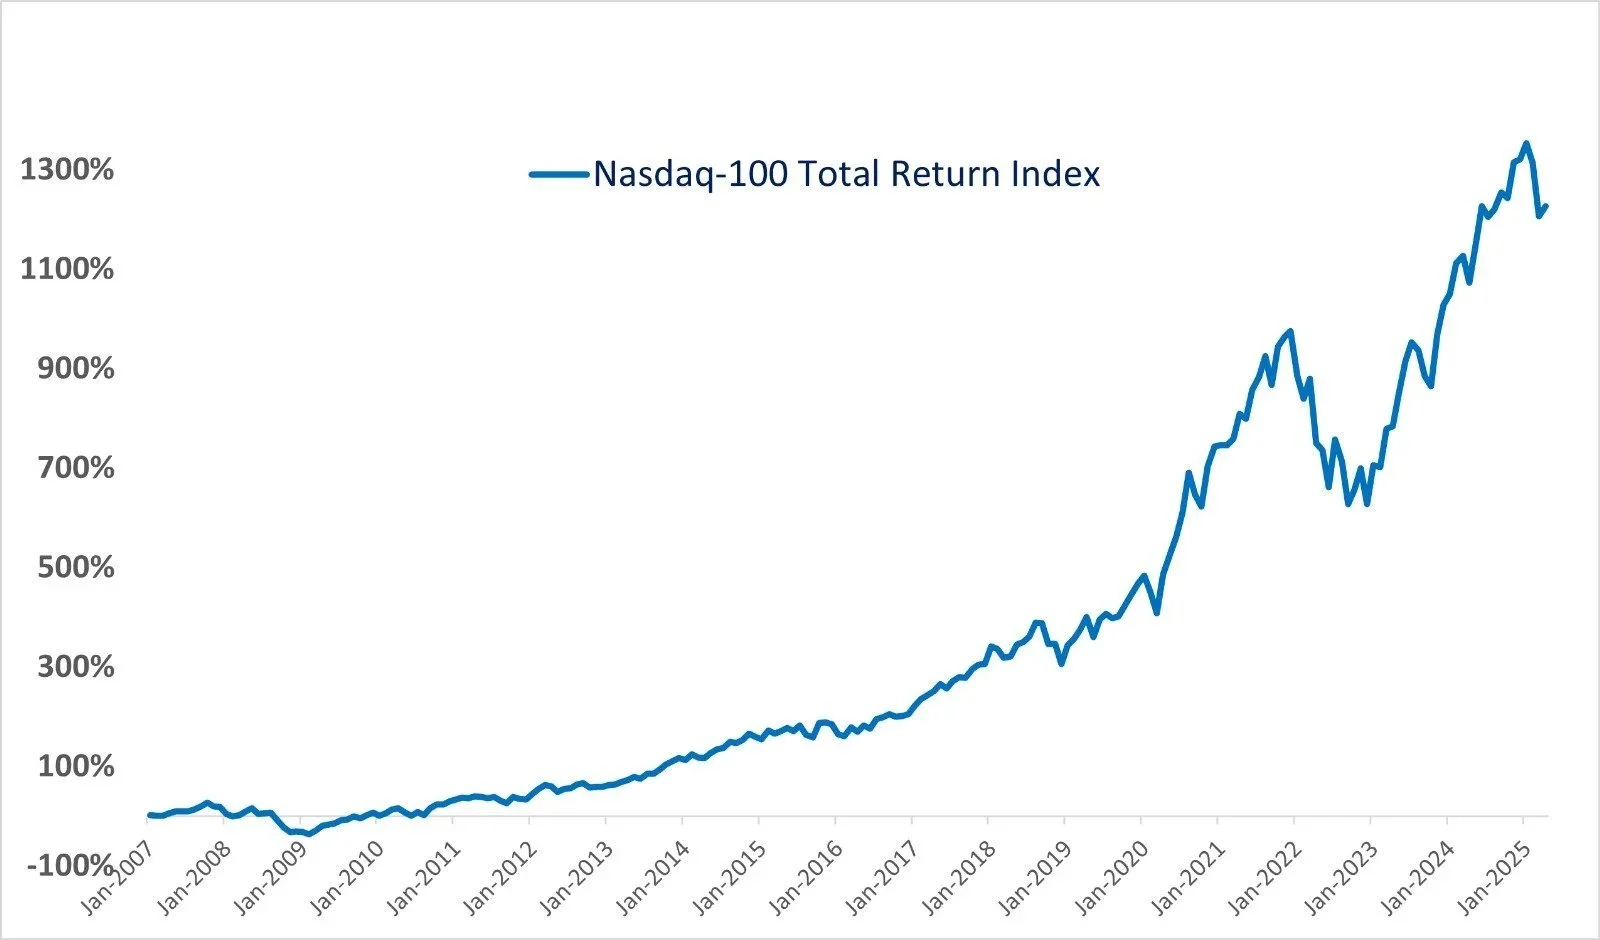
Figure 1.
Step Two: The Random 5
Have you heard the classic Wall Street quip that goes something like this:
“A monkey throwing darts at a newspaper’s financial pages could select a portfolio that would do just as well as one picked by the experts.”
So, we tested what happens if you simply pick five random stocks each month from the universe of Nasdaq-100 stocks - literally random, selected by formula, not by us.
We also used the most recent month’s daily volatility to weight each of the five stocks: more capital to low-volatility stocks, less to the high-volatility ones.
And guess what? Even random stocks produced decent outcomes. Why? Because we’re picking from the cream of the crop. Random selection still works - when your universe is elite.
Figure 2 shows the results of this “Random 5” strategy. This shows the results of 10 tests. Please note, the Nasdaq-100 still performs really well, purely because the index is weighted in favour of the largest stocks, which gives it the extra “boost”.
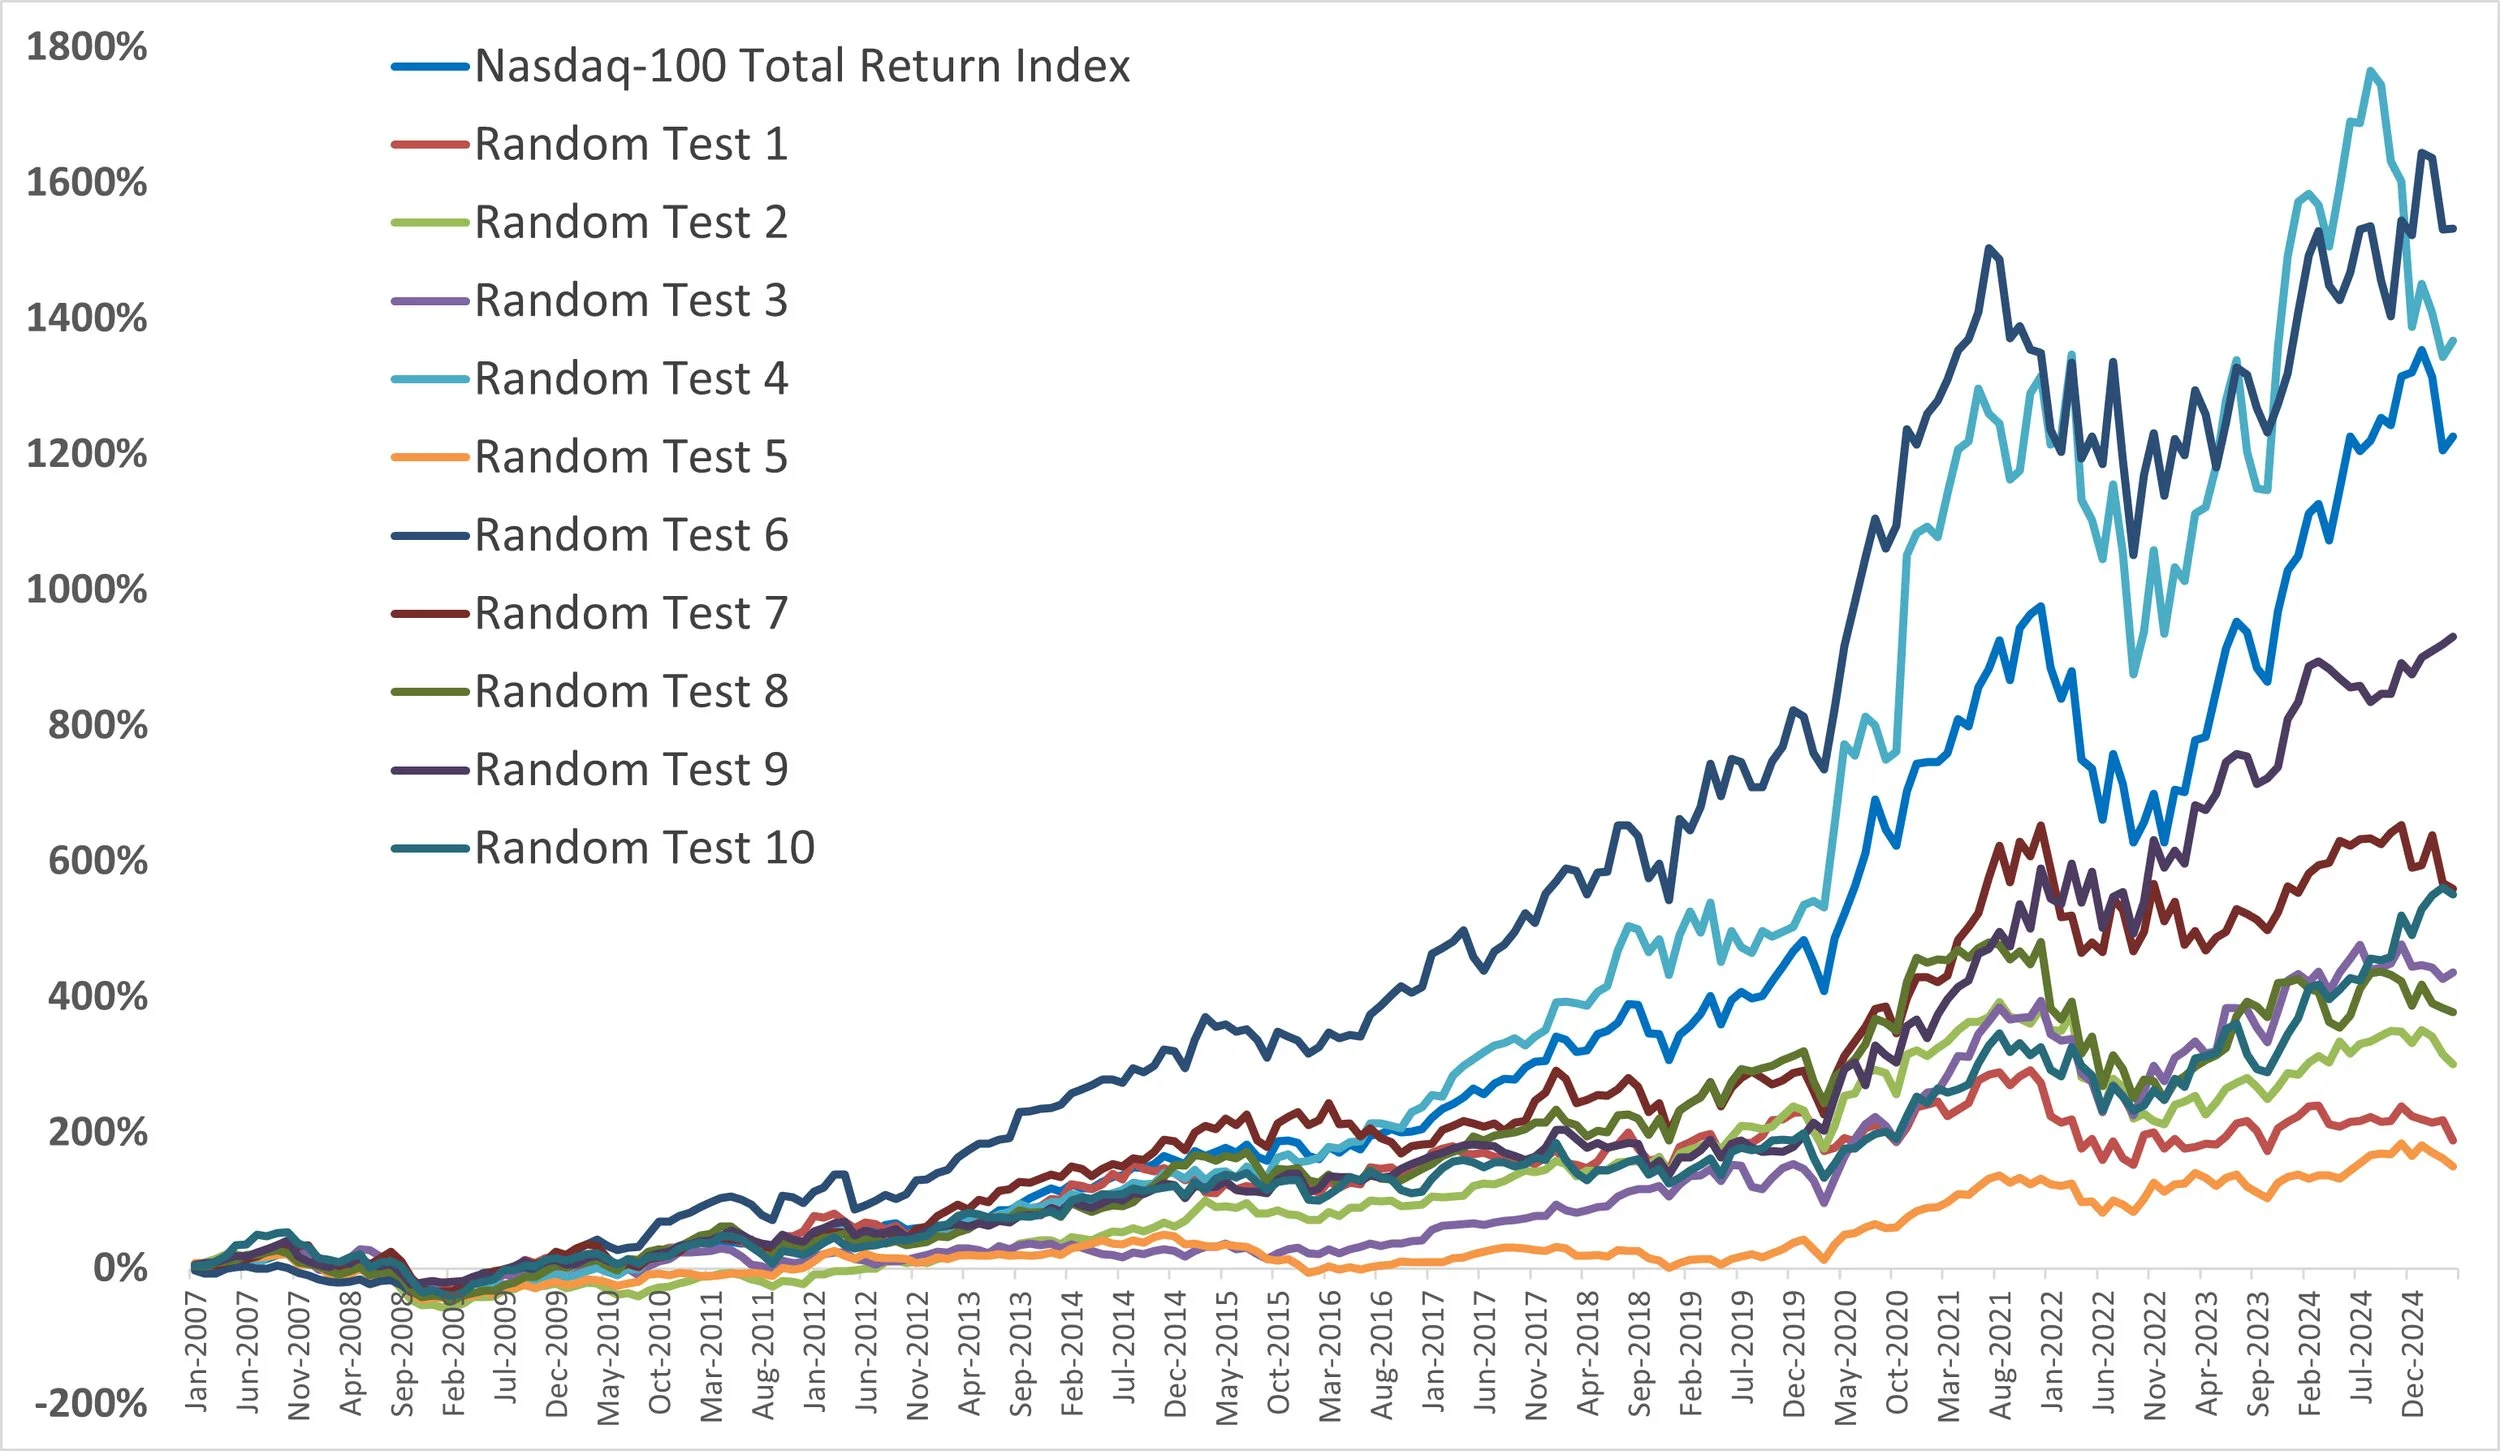
Figure 2.
Step Three: Traditional Momentum
Now, here’s how most of the industry and academia define a basic momentum strategy: simply use the total return (performance) of each stock over the past 6, 9, or 12 months, rank the stocks from best to worst, and select the top performers in a monthly or quarterly rebalance. That’s it.
For this test, we once again used the universe of Nasdaq-100 stocks. We applied a 6-month lookback to rank stocks purely on total return for each stock and - just like before - allocated money based on the previous month’s daily volatility.
Figure 3 shows the results using this very simple, very generic “total return” metric. And yes - it doesn’t just mildly outperform the random portfolios and the index… it crushes them.
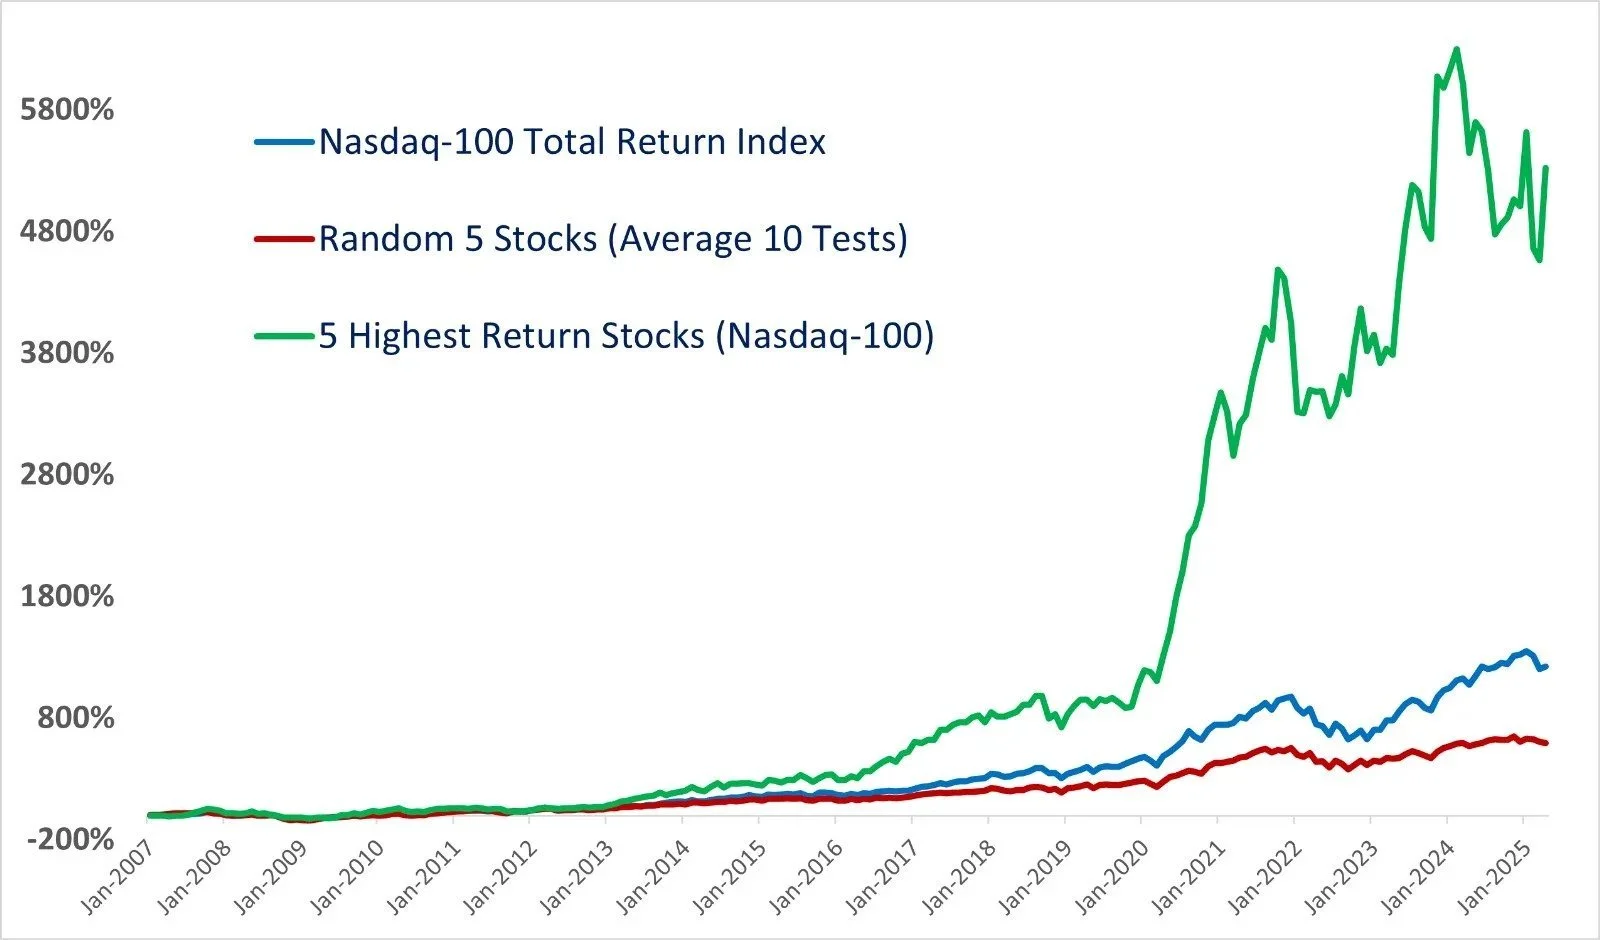
Figure 3.
If you’re a researcher, this is already a WOW moment. This alone proves, without question, that momentum is real. It also shows how easily the traditional hedge fund world can be challenged.
But it gets even better.
Step Four: Our Metrics — The Real Edge
Years ago, when we set out to build a stock selection strategy that could consistently outperform the market over the long term, we leaned heavily on creativity and lateral thinking. We built metrics using nothing but price data: daily highs, lows, closes, and volume.
These metrics don’t exist in the rest of the fund management industry.
We got great results early on. But here’s the interesting part: we didn’t even realise we had built an advanced momentum system that was capturing core aspects of behavioural finance. We didn’t fully grasp it ourselves at first.
Only after diving deep into academic research and reading every book and paper we could find did we realise:
a) Momentum investing is a well-studied phenomenon, and
b) Other researchers had uncovered similar financial behaviour to what we’d found on our own.
It was both exciting and strange - like inventing something and only later learning it already has a name. Except, we do it differently:
The Super Seven
After years of refinement and evolution, we now use seven proprietary metrics that are far superior to basic total return in identifying momentum. These metrics allow us to uncover investor psychology, conviction, trend strength, and structural inefficiencies in the market - all through price data alone.
That’s Figure 4. The purple line.
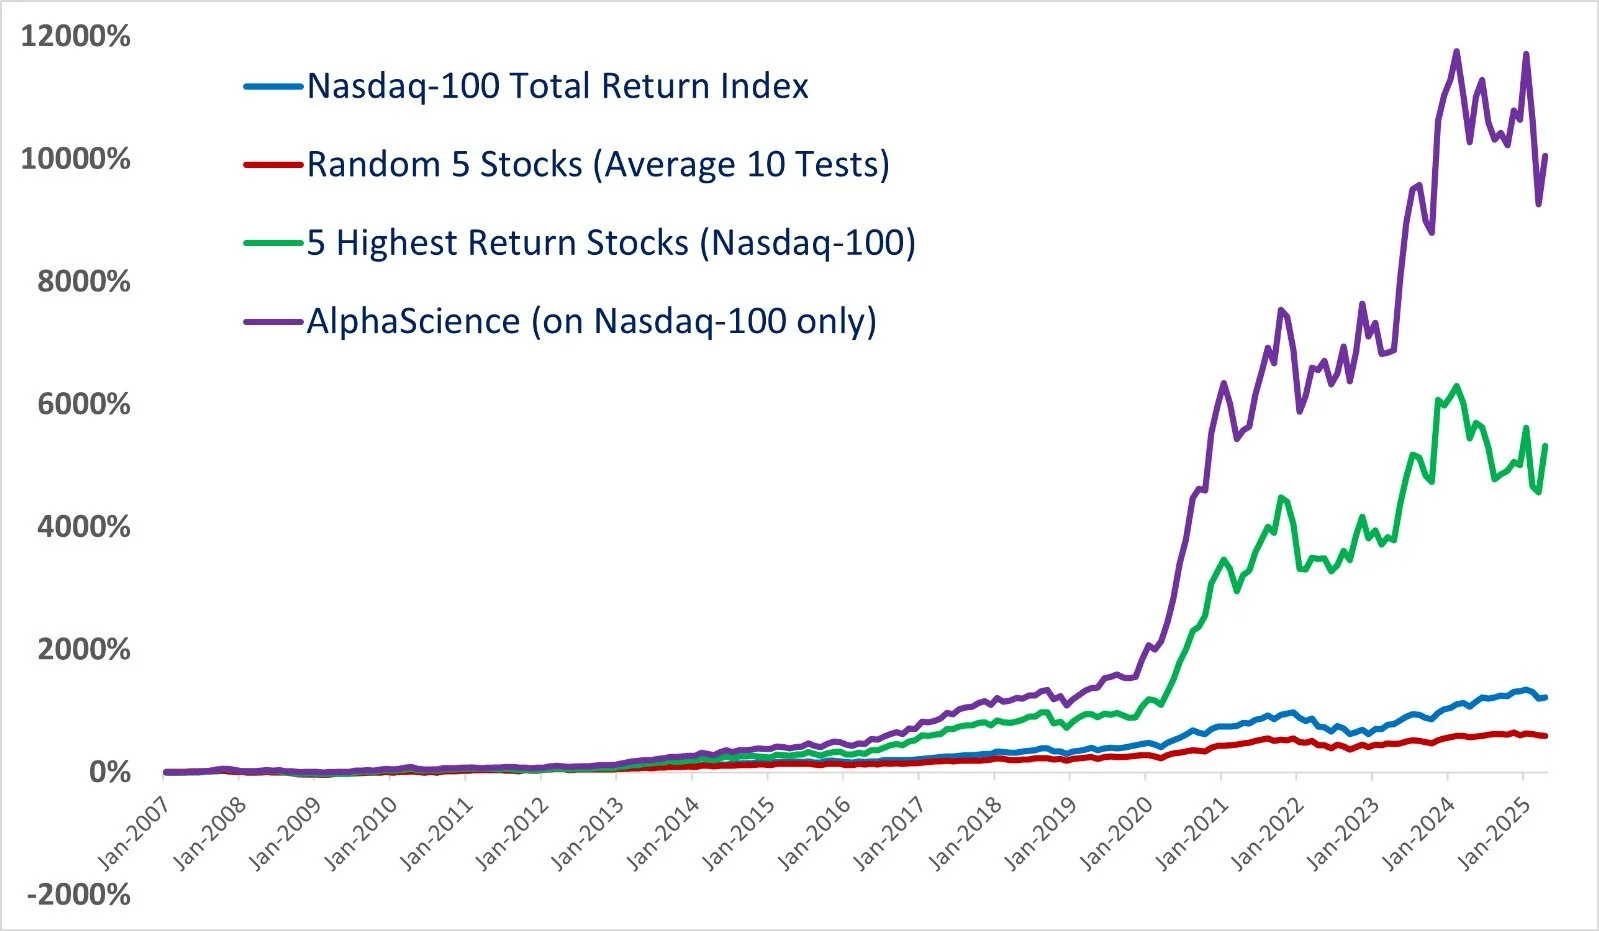
Figure 4.
And yes, before you ask: it works on the S&P 100, on European index stocks, on Canadian, Australian, or any other index - it works everywhere. The result is always the same.
It works well on a 4, 5, 6, 7, 8-month lookback and even longer (so we did not curve-fit it).
Final Thoughts: The Proof Is Here
Now you understand why I called this our most important blog post ever.

We don’t want to shout this from the rooftops - but if you’re a current or future investor, this should be the ultimate proof.
But - to emphasise - all of this works over the long term. We don’t always outperform the index in the short run, but over the long term is where the real magic happens.
It’s what gives us the confidence to say - loudly, clearly, and without doubt:
It works. It works. It works.
Blog post by Etienne Paul Botes
June 7, 2025.
The Stock Market Might Be Rigged — In Your Favour
It may surprise you how many traders and fund managers have a history or hobby involving games of chance- blackjack, poker, even roulette.
Some have done exceptionally well. But let’s be clear: there is a vast difference between gambling and professional fund management.
Still, what draws many quantitatively-minded investors to both is the common thread: statistics, probabilities, and identifying inefficiencies.
From the Casino Floor to Wall Street
Names like Ed Thorp, Bill Benter, Blair Hull, David E. Shaw, Jim Simons and Nassim Nicholas Taleb all illustrate the fascinating overlap between gambling strategy and quantitative finance. Many of these figures either came from professional gambling backgrounds or applied gambling-related statistical models to financial markets.

Imagine walking into a casino where the blackjack shoe has an unusually high number of face cards - or discovering a roulette wheel biased just enough to favour a specific number sector. These small statistical edges can be exploited over time.
That is precisely the mindset we apply at AlphaScience. While our system is far more sophisticated than a game of cards, our approach is driven by stacking the odds relentlessly in our favour - before we even deploy our core quantitative model.
This thinking isn't just theoretical; it’s something any serious investor can apply.
1. Stocks Already Offer a Statistical Edge
We begin with a basic but powerful observation: equities have outperformed every other major asset class over the long term - be it gold, silver, commodities, real estate, currencies or even bonds.
According to historical data, global equities have delivered real returns in the range of 6–7% annually over the last century. Simply choosing to invest in stocks already places the investor on the statistically favourable side of the ledger.
2. Equities Have a Built-In Bull Market Bias
Unlike commodity or currency markets - where supply and demand can push prices in either direction - the stock market benefits from a long-term structural bias to the upside.

Why? Because equities represent ownership in companies with a mission to grow: revenues, profits, customer bases, product lines. More importantly, the market is underpinned by mandatory, recurring buying from:
Pension and retirement funds
Endowments
Sovereign wealth funds
Insurance companies
Index-tracking ETFs and mutual funds
Trusts and fiduciary managers
These massive, non-speculative inflows contribute to a consistent upward drift over time - despite short-term volatility.
3. Developed Markets: The Historical Outperformers
While emerging markets may offer the illusion of diversification and growth potential, historical data shows that developed markets - especially the US and Europe - have consistently outperformed on both return and risk-adjusted bases.

Moreover, globalisation has led to higher correlation among global markets. Diversifying into emerging markets no longer delivers the uncorrelated benefits it once did.
Thus, focusing our exposure on the most stable, proven equity markets further tilts the odds in our favour.
4. Size Matters: Why Large Caps Win More Often
While it’s tempting to chase meteoric returns from small-cap and mid-cap stocks, long-term evidence favours large-cap stocks.
These companies are generally more stable, liquid, and resilient - especially during downturns.

Large Caps tend to benefit from scale, access to capital, strong corporate governance, and brand strength. Over time, they provide a superior risk-adjusted return with lower volatility.
At AlphaScience, we deliberately invest only in Large Caps to reduce fragility and increase reliability of returns.
5. Then We Add Momentum and Conviction
Even before we apply our core strategy - monthly momentum-based selection - we’ve already stacked a series of statistical edges in our favour:
Asset class (equities)
Structural market inflows (pension and institutional demand)
Market selection (developed markets)
Capitalisation bias (Large Cap)
To this, we add:
Momentum: Riding trends backed by real money flows and investor behaviour
Concentration: Investing in a select group of high-conviction stocks rather than diluting our edge across a sprawling portfolio
The result: a repeatable, robust system that behaves like a probability machine.
The Caveat: It’s not that easy
Now, let’s not be seduced by the metaphor. Just because the market might be rigged in your favour, doesn’t mean success is easy or guaranteed.
To turn odds into results, you still need:
A long-term time horizon
Sound risk management and capital allocations
Psychological resilience, especially during drawdowns
Discipline and consistency
Without these core principles, even the most statistically favourable system can fail.
The house edge only works when you stay in the game long enough.
References
Carlson, Ben. "Historical Returns for Stocks, Bonds, Cash, Real Estate and Gold." A Wealth of Common Sense, 2 January 2025.
Silverhall Wealth. "Long-Run Asset Returns: A Deep Dive into Historical Real and Nominal Returns." Silverhall Wealth.
Cambridge Judge Business School. "Report: Stocks Have Far Outperformed Over the Past 125 Years." Cambridge Judge Business School, 2025.
Bessembinder, H. (2018). "Do Stocks Outperform Treasury Bills?" Journal of Financial Economics, 129(3), 440–457.
Siegel, J. J. (2014). Stocks for the Long Run: The Definitive Guide to Financial Market Returns & Long-Term Investment Strategies (5th ed.). McGraw-Hill.
Gompers, P. A., & Metrick, A. (2001). "Institutional Investors and Equity Prices." The Quarterly Journal of Economics, 116(1), 229–259.
Sushko, V., & Turner, G. (2018). "The Implications of Passive Investing for Securities Markets." BIS Quarterly Review, March 2018.
Hirshleifer, D. (2001). "Investor Psychology and Asset Pricing." The Journal of Finance, 56(4), 1533–1597.
Malkiel, B. G. (2003). "The Efficient Market Hypothesis and Its Critics." Journal of Economic Perspectives, 17(1), 59–82.
Dimson, E., Marsh, P., & Staunton, M. (2023). "Global Investment Returns Yearbook 2023." Credit Suisse Research Institute.
Fama, E. F., & French, K. R. (2012). "Size, Value, and Momentum in International Stock Returns." Journal of Financial Economics, 105(3), 457–472.
Bekaert, G., Hodrick, R. J., & Zhang, X. (2009). "International Stock Return Comovements." The Journal of Finance, 64(6), 2591–2626.
Forbes, K. J., & Rigobon, R. (2002). "No Contagion, Only Interdependence: Measuring Stock Market Comovements." The Journal of Finance, 57(5), 2223–2261.
Goetzmann, W. N., Li, L., & Rouwenhorst, K. G. (2005). "Long-Term Global Market Correlations." The Journal of Business, 78(1), 1–38.
Ang, A., Hodrick, R. J., Xing, Y., & Zhang, X. (2006). "The Cross-Section of Volatility and Expected Returns." The Journal of Finance, 61(1), 259–299.
Ibbotson, R. G., & Idzorek, T. M. (2014). "Dimensions of Popularity." The Journal of Portfolio Management, 40(5), 68–77.
Chordia, T., Roll, R., & Subrahmanyam, A. (2001). "Market Liquidity and Trading Activity." The Journal of Finance, 56(2), 501–530.
Blog post by Etienne Botes
May 26, 2025.
Crypto: The Cult of Digital Nothingness
It might seem strange - even contrarian - to publish a piece critiquing cryptocurrencies in the very week that Bitcoin has reached all-time highs. To many, this would seem like the ultimate market vindication.
However, tulips once traded for mansions.
Manias don’t die because sceptics speak up - they die because reality intrudes.
But this is not a market note. This is a reflection on value, belief, and what we, as investors and as human beings, choose to place our faith in.
As a free-market capitalist, I believe in the right of consenting adults to engage in speculation, commerce, and even folly.
A market, after all, exists whenever a willing buyer and seller meet. And crypto is undeniably a market - an extraordinarily popular one for speculation.
I’ve seen that first-hand through the use of the Vortex Indicator, the technical analysis tool I created, which is widely employed on crypto trading platforms around the world.
I respect the freedom of free people to engage in that. But this freedom must be coupled with clear-eyed awareness of what exactly we are participating in.
Because for all the hype, all the price action, and all the passion - crypto remains a belief system, not a financial system.

Invented Value, Worshipped Worthlessness
Crypto offers no intrinsic value. It generates no income. It has no cash flows, no utility, and no fundamental economic underpinning.
It is not a claim on any productive enterprise. It is not legal tender. It does not pay interest or rent.
It is not a commodity in any classical sense.
It is, instead, a pure speculative instrument whose price is determined solely by collective sentiment - the Greater Fool Theory: the fervent conviction that someone, someday, will pay more for it than you did. It is pure abstraction, a digital token with no tether to reality beyond the belief that it is "the future."
This is not new. Humanity has always had a remarkable ability to construct belief systems around unseen, unproven forces. Religion, mythology, ideology - all are testaments to the human capacity for invention and faith. And like these, crypto is a construct. It exists because people believe it does.
No Use, Just Abuse
In the 17 years since the invention of Bitcoin - which makes it nearly as old as the iPhone, and older than Apple Pay - crypto has consistently promised, and failed, to deliver mainstream legal use cases. It is still not a widely used medium of exchange.
It has not meaningfully displaced fiat currencies. And it has not revolutionised payments or banking.
Instead, crypto has flourished where the law fails.

It is a tool of extortion, money laundering, and increasingly, political bribery. The most prominent and consistent applications of cryptocurrencies have been in ransomware attacks, anonymous transfers for criminal enterprises, and schemes designed to deceive and defraud the uninformed.
This isn’t incidental. This is the core of the industry.
Money-laundering and investor scams are not unfortunate behaviours that taint an otherwise promising innovation. They are the enterprise. Crypto has become the mechanism by which bad actors transfer wealth, hide funds, and lure in speculative capital from retail dreamers chasing outsized returns on thin air.
Whatever language future legislation uses to describe or regulate crypto, the result will still be the same: it will be enabling an enterprise that is, at its root, a vessel for deception.
Even as crypto’s criminal uses proliferate, it is currently gaining a surreal political¹ legitimacy.
The same U.S. administration whose First Family² reportedly profited from crypto promotions now floats the idea of a "crypto reserve" - an attempt to launder crypto’s reputation through state endorsement. This isn’t innovation; it’s regulatory capture by speculators, dressing up a speculative cult as national policy.
A Digital Religion, Built on Code
Crypto has all the characteristics of religion: prophets (crypto “thought leaders”), rituals (halvings, forks), temples (blockchain conferences), and a devout, often uncritical congregation.
It promises salvation - from centralised banks, from inflation, from the state - and offers freedom through belief. But unlike traditional religions, which at least claim moral or metaphysical guidance, crypto offers no such philosophy. It offers only price movement. And belief in price, unanchored to value, is a dangerous foundation for capital.
Yes, the blockchain may have utility in select areas - record-keeping, supply chains, digital verification.
But blockchain is a tool. Tokens are not. The conflation of the two is the magic trick that keeps the illusion alive.

Faith is not a strategy
At AlphaScience, we invest in reality.
Our capital is allocated exclusively to the two largest and most advanced economies in the world: the United States and Europe.
We focus on the world’s leading companies - those that build, heal, entertain, defend, and drive civilisation forward.
From life-saving biotechnology and global entertainment, to cement, infrastructure, aerospace, and defence systems used in the fight against global aggressors.
These are not promises; they are products. In a world seduced by digital illusions, we remain committed to investing in what is tangible, enduring, and real.

The Silver Lining: Human Ingenuity Unleashed
And yet - I do not end this criticism in despair.
Because, paradoxically, the very ability that allows mankind to construct myths, religions, and speculative manias - is the same brilliance that has birthed science, art, mathematics, medicine, and markets. The same imagination that dreams up false gods is also responsible for real breakthroughs.
Crypto is, in its own way, a testament to human creativity - just not one rooted in value. And while this particular belief system may collapse under its own weight, we should still admire the extraordinary capacity of the human brain to invent, organise, and convince.
That ingenuity is not always used wisely. But it is always awe-inspiring.
References:
1. The Crypto Industry Got What It Paid For - The Verge
2. The Real Trump Family Business Is Crypto - The Atlantic
Blog post by Etienne Paul Botes
May 6, 2025.
Artificial Intelligence and Hedge Funds – A False Promise?
In the year AD 2025, the first question we’re often asked as a quantitative momentum fund is:
Is AlphaScience an AI fund?
Before we answer that, it’s worth stepping back to ask a broader question:
Is artificial intelligence an existential threat to us - and to the hedge fund industry as a whole?

Revolution or Hype?
First, we need to distinguish how AI is actually used in finance.
Financial advisors, as one example, use it to sift through huge amounts of data and tailor solutions for clients. Some hedge funds, on the other hand, leverage AI to analyse company fundamentals, earnings calls, or masses of other financial information.
In all these cases, AI excels as a data processing assistant - not as the core of an investment strategy.
Unfortunately, the AI hype has also led to the phenomenon of “AI Washing” – where some unscrupulous participants in the industry simply pretend to be using AI, when in reality they are simply using basic quantitative techniques.
Then there are hedge funds built entirely around AI-driven strategies.
These use machine learning (ML) for algorithmic trading, pattern recognition, and predictive analytics. Techniques like random forests, ensemble learning, and neural networks attempt to uncover nonlinear relationships between data and price movements. Some even deploy reinforcement learning to evolve their strategies over time.
Sounds unbeatable, right? Not so fast.
The Reality: Mixed Results and Missed Expectations
Academic research and industry data paint a more sobering picture.
Yes, AI can help with risk management, trade execution, operational efficiency and processing vast information flows. Its speed may also give short-term traders an edge.¹ ² ³ ⁴
But when it comes to actual large-scale fund management returns, AI-driven funds have struggled to beat traditional benchmarks.⁵ ⁶ ⁷
A review in the International Journal of Data Science and Analytics ⁸ analysed 27 peer-reviewed studies on AI in equity investing. It found that the Eurekahedge AI Hedge Fund Index ⁹ significantly underperformed the S&P 500 and MSCI World Indexes from 2011 to 2025.
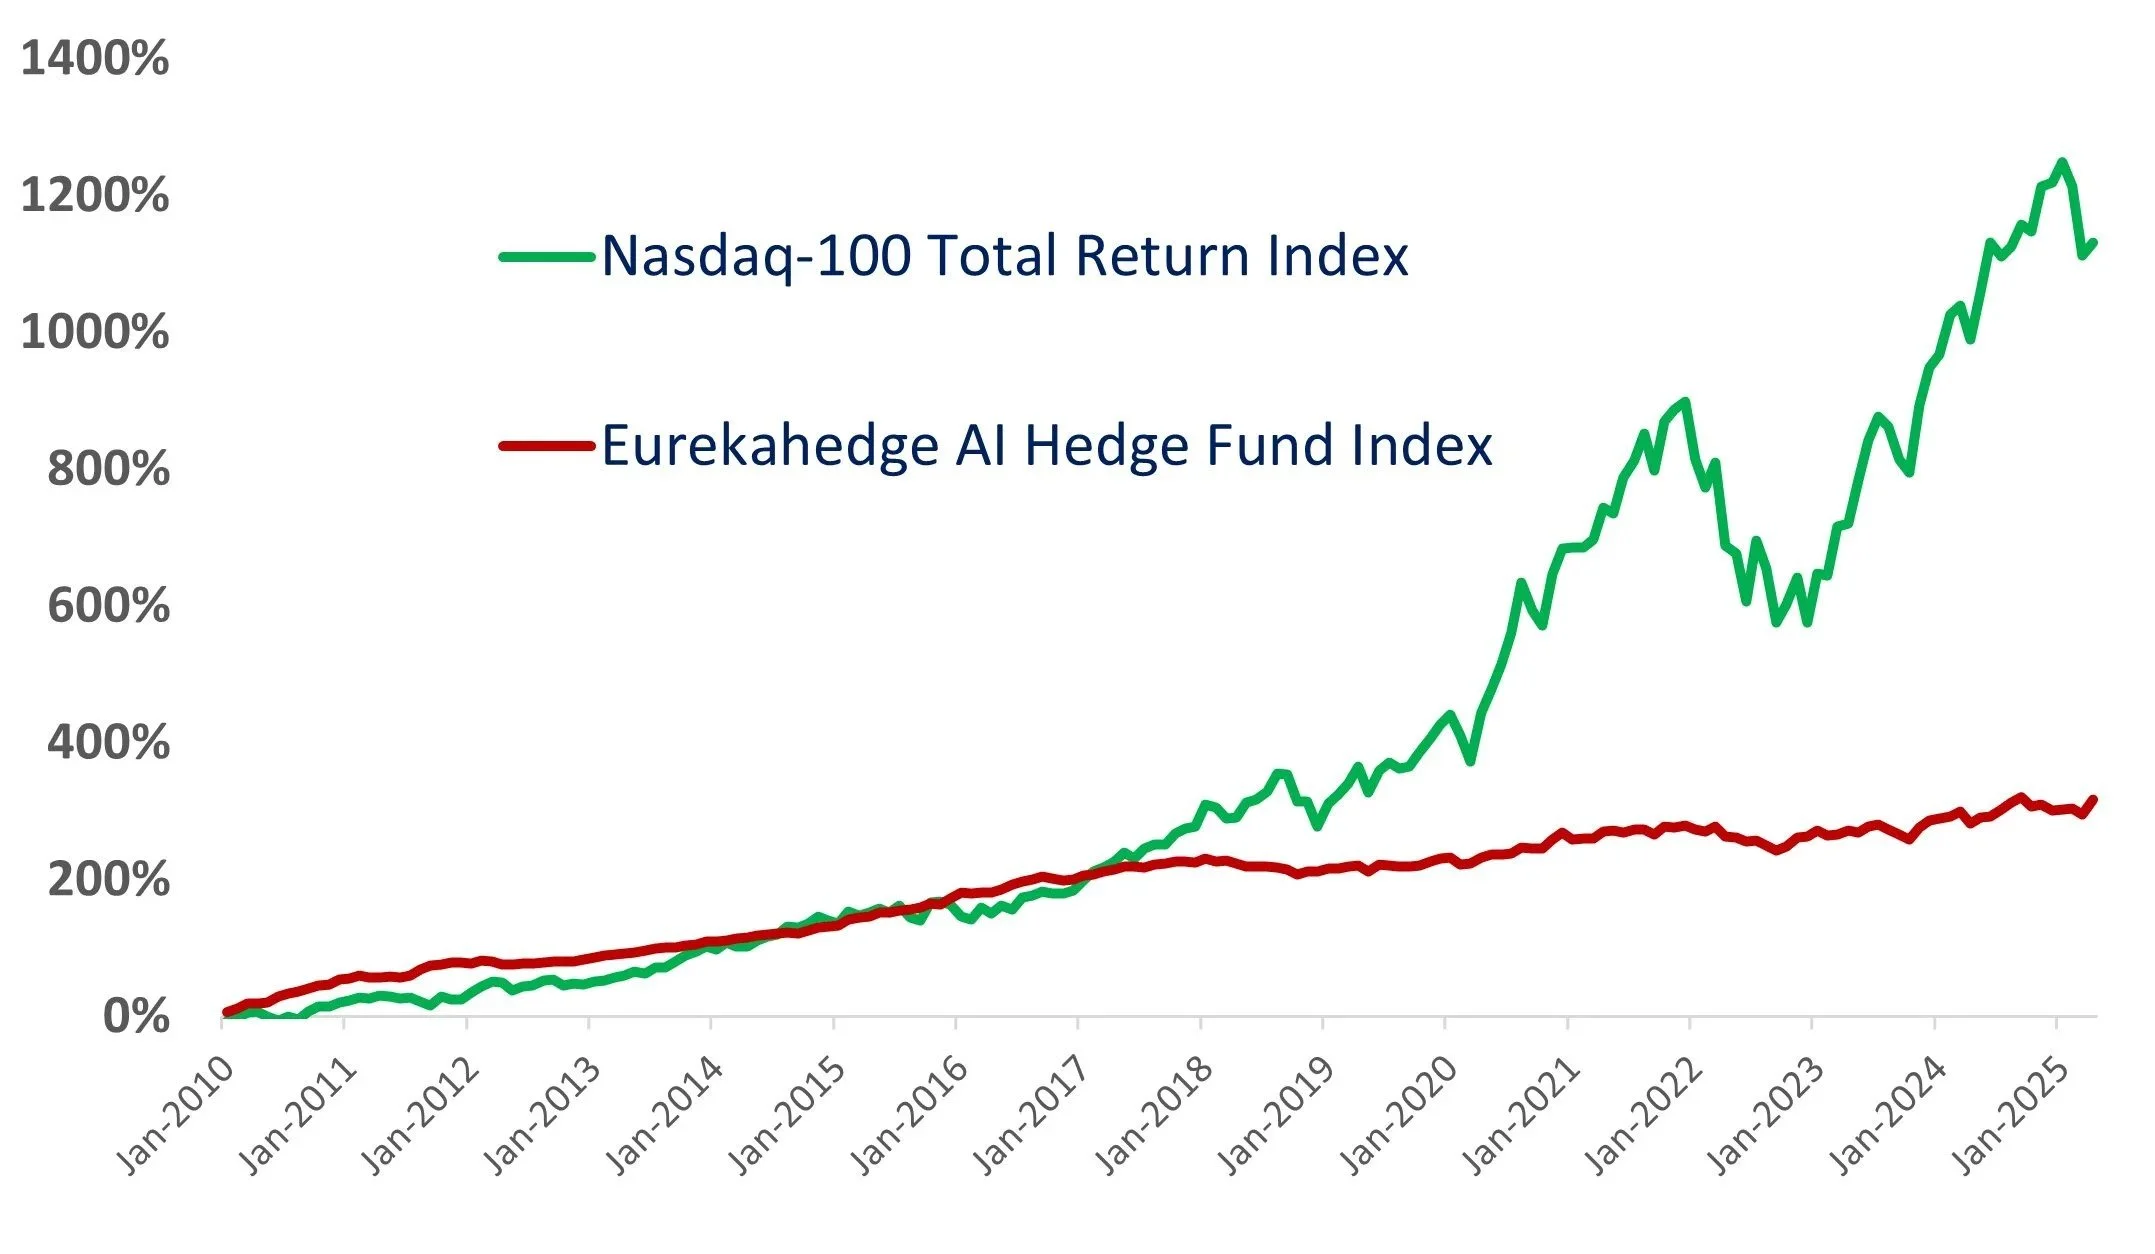
AI versus the basic stock market…
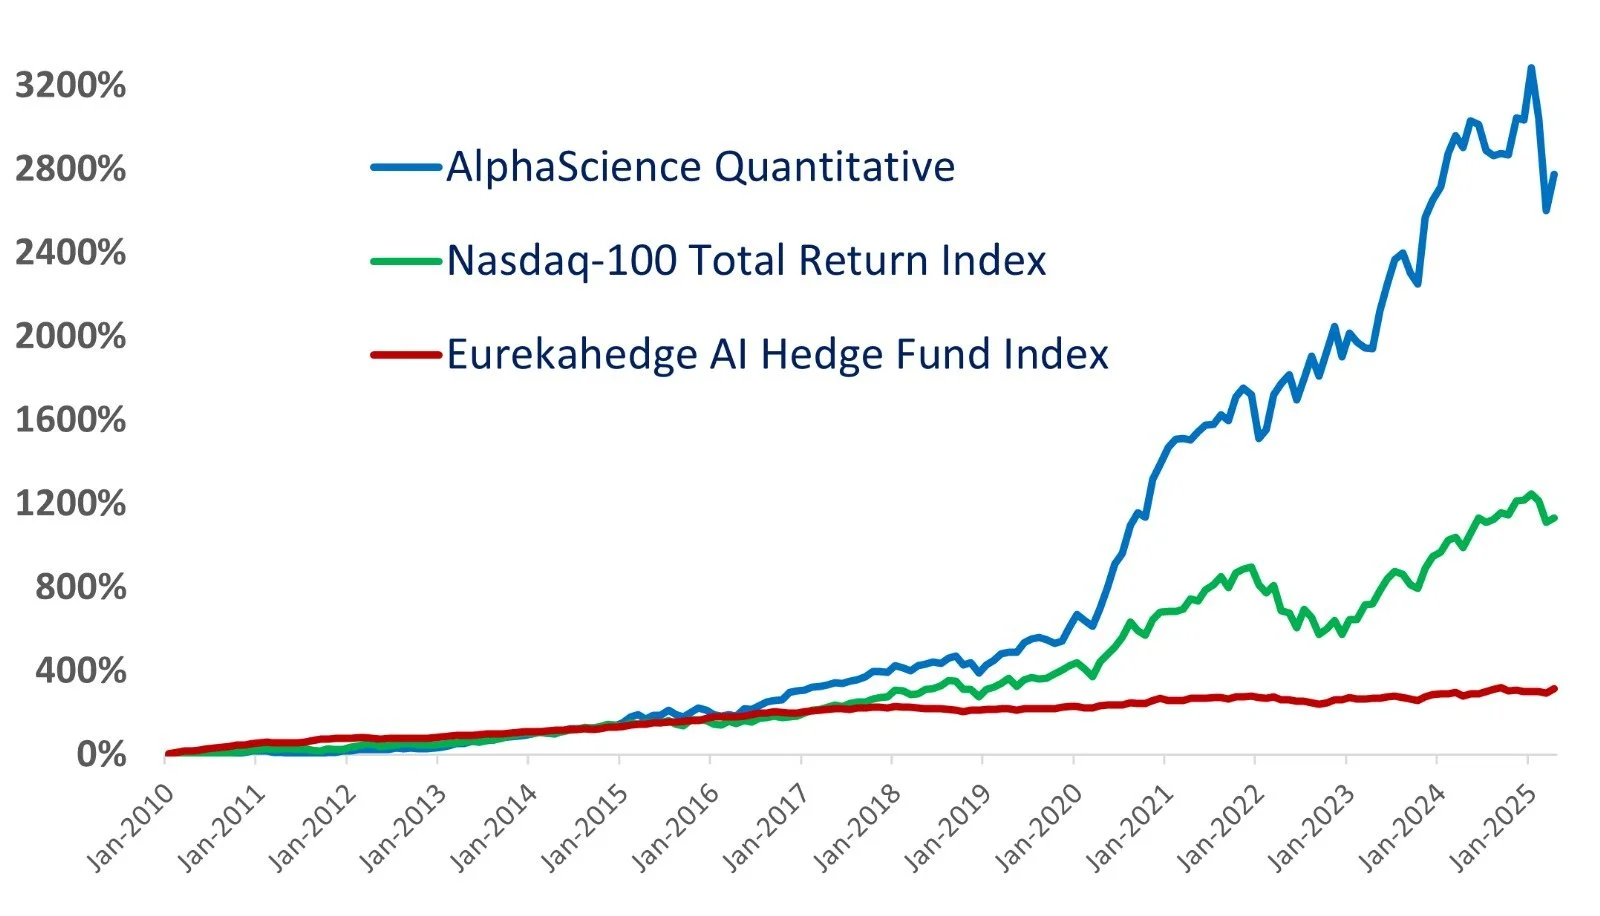
…and what happens when AlphaScience Quantitative Momentum is added.
Their conclusion?
“There is no conclusive evidence of any ML-driven investment funds delivering spectacular returns at scale. All market data indicates substantial underperformance compared to benchmark indices.”
More revealing, Boczynski, Cuzzolin, and Sahakian wrote:
“The picture of real-world AI-driven investments is ambiguous and conspicuously lacking in high-profile success cases (while it is not lacking in high-profile failures).”
Our own observations mirror these findings.
AI is an invaluable tool in the investment process - especially for fundamental research, portfolio design, and operational support. But as a standalone investment strategy? The evidence is thin.

Our Experience with AI
So, have we tried AI ourselves in our momentum stock selection process?
Yes we have.
We experimented extensively with AI/ML to explore novel stock selection metrics. Using tools like XGBoost and SMOTE in Python / Jupyter notebooks on Google Colab, we analysed price and volume data from the Nasdaq 100 and S&P 100 to identify potential improvements.
The result? AI didn’t deliver. Despite rigorous testing, we found that AI could not generate any significantly new momentum signals. At best, it produced slight tweaks on already well-known metrics.
Why? Because AI lacks what still sets humans apart: creativity.
Intelligence does not equate to creativity.
And sometimes, creativity = weirdness.
Fortunately, we have weirdness in abundance.
Why AlphaScience Stays Human-Powered
We don’t see AI as a threat to our strategy, nor do we believe it offers a consistent edge in large-scale fund management.
Here’s why: AI models rely on historical data. If multiple funds use AI for momentum strategies, they’ll likely pick the same stocks, leading to overcrowded trades and reduced returns. The market becomes a hall of mirrors, reflecting the same signals.
Our quantitative momentum approach is grounded in rigorous research and the scientific method. Yet, human creativity remains our core. It’s what sets us apart in a world of algorithms.
The Twist: AI Could Fuel Our Wins
Here’s the fun part. Even if AI-driven funds proliferate, AlphaScience can still come out on top. If countless investors use AI to select stocks, their buying will create price movements. Our AlphaScience System, designed to detect momentum, will spot these trends and ride the wave. AI’s momentum behaviour becomes our opportunity.

The Human Element Still Wins
AI is a phenomenal tool, but it’s not a silver bullet for hedge fund success.
Our quantitative momentum strategy is rooted in the scientific method: observation, hypothesis, testing, iteration.
But at the core of AlphaScience is human ingenuity - the bold questions, the creative leaps, and yes, the occasional weird idea that works.
That’s not something you can automate.
References
1. Lopez de Prado, M. (2019) ‘Can Machines “Learn” Finance?’, The Journal of Financial Data Science, 1(1), pp. 10–21.
2. Zhang, Z., Zohren, S. and Roberts, S. (2020) ‘Deep Learning for Portfolio Optimization’, The Journal of Financial Data Science, 2(4), pp. 8–20.
3. Gu, S., Kelly, B. and Xiu, D. (2021) ‘Artificial Intelligence and Systematic Trading’, The Journal of Financial Economics, 141(2), pp. 641–666.
4. Agarwal, V. and Ren, H. (2023) ‘Hedge Funds: Performance, Risk Management, and Impact on Asset Markets’, Oxford Research Encyclopedia of Economics and Finance. Oxford University Press.
5. Bachelier, L. and Sornette, D. (2020) ‘Do Hedge Funds Use AI Effectively?’, The Journal of Portfolio Management, 46(4), pp. 56–70.
6. Harvey, C.R. and Liu, Y. (2021) ‘The Limits of Machine Learning in Hedge Fund Performance’, The Journal of Financial Data Science, 3(2), pp. 30–46.
7. Fabozzi, F.J. and López de Prado, M. (2022) ‘Artificial Intelligence in Asset Management: Hype or Reality?’, The Journal of Financial Data Science, 4(1), pp. 10–29.
8. Buczynski, W., Cuzzolin, F. and Sahakian, B. (2021) ‘A review of machine learning experiments in equity investment decision-making: why most published research findings do not live up to their promise in real life’, International Journal of Data Science and Analytics, 11(3), pp. 221–242.
9. https://platform.withintelligence.com/performance/indices/11793
Blog post by Etienne Botes
May 1, 2025.
Pursuit of Perfection: Why Quant Investing Is Like Formula One

The world used to divide into two types of people: those who thought Formula One was mind-numbingly boring, and those who could recite engine specs on demand. Best avoid those at a dinner party.
Then Netflix changed the game. By distilling the drama - the rivalries, the personalities, the stakes - into a gripping series, they created a third group: a whole new audience who suddenly got it.
But there is another way to look at Formula One.
Beneath the glamour lies a masterclass in competitive edge. While “Drive to Survive” brought Formula One to mainstream audiences, its deeper value lies in the sport’s scientific core.
The Laboratory of the Track
Every Grand Prix is a live experiment. Engineers test hypotheses in real time: a redesigned front wing either cuts lap times or fails under Monza’s brutal curves. There’s no ambiguity - the stopwatch decides.

The best teams don’t win by luck. They win because they’re obsessed with process - shaving milliseconds through relentless iteration. A wing adjustment here, a suspension tweak there. Over a season, those micro-gains compound into dominance. Formula One is more than a sport - it’s a laboratory for relentless innovation.
The Adrian Newey Principle: Obsession Wins
I recently finished reading an autobiography called “How to Build a Car” by Adrian Newey.
Trained as an aerodynamicist, he became arguably the greatest race engineer ever, driving the success of teams like Williams, McLaren, and Red Bull.
His cars propelled drivers like Alain Prost, Mika Häkkinen, Sebastian Vettel, and Max Verstappen to World Championships.

His genius lay in refining minutiae - the angle of a rear diffuser, the curve of a bargeboard.
Each tweak alone meant little. Together, they made his cars unbeatable. Marginal gains create champions.
Sound familiar? It should.
AlphaScience as a Formula One Team
Our "races" unfold monthly. The competition? Benchmarks like the S&P 500 and Nasdaq-100 are the reigning champions most hedge funds struggle to beat.
Like an F1 team, we are constantly trying to come up with new ideas, new metrics and new methods to try to improve the performance of our momentum quantitative strategy.
The difference? We replay historical ‘races’ to stress-test every adjustment.
The massive advantage we have over Red Bull and McLaren is that we can go back in time and re-run every month’s race in different simulations - all 218 of them.

The Finish Line
By no means do we compare ourselves to the high-octane performance and glamour of Formula One – the real parallel is in the method: the relentless cycle of testing and improvement.
The Nasdaq-100 and S&P 500 might win some months (or even seasons). But like a top F1 team, we focus on the long term: over 3, 5, or 10 years, our incremental gains aim to outpace them.
Also, the reality check: while F1’s stakes could be life-and-death, at least a bad month for us isn’t going to wreck and destroy our car.
Therefore, AlphaScience isn’t just about raw monthly performance - it’s about the process. We optimise systems through a continued process of hypotheses, testing, tweaking, rejecting, and repeating - until only the strongest ideas survive.
And we’re getting better. One race at a time.
Blog post by Etienne Paul Botes